15 Companies including HCL Technologies Ltd., Nestle India Ltd., 360 One Wam Ltd., 360 One Wam Ltd., Tata Investment Corporation Ltd., Tata Elxsi Ltd., Central Mine Planning & Design Institute Ltd., Transformers & Rectifiers (India) Ltd. reported their results yesterday.

HCL Technologies

ParticularsFY 2025-26 (Audited)FY 2024-25 (Audited)% Change (YoY)
Revenue from Operations130,144 Cr117,055 Cr+11.18%
Net Profit (PAT)16,652 Cr17,399 Cr-4.29%
Earnings Per Share (Basic)61.46 64.16 -4.21%

HCL Technologies Ltd.HCLTECH₹1,287.90 -10.64%

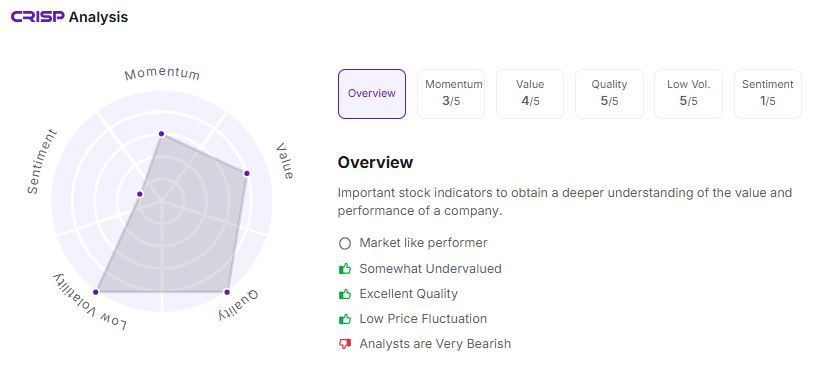
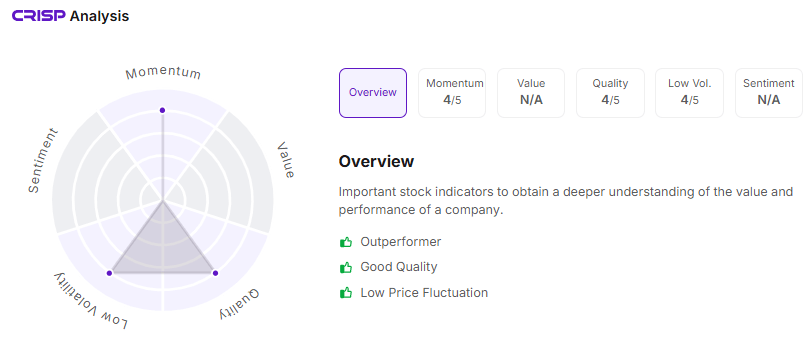
  • HCL Technologies missed its financial year 2026 revenue growth guidance. What was projected to be a growth between 4% to 4.5%, turned out to be 3.9% for the year.
  • The company posted its first profit decline in 16 years as weak discretionary spending and new labour costs hit margins. Outlook for FY27 remained cautious.
  • It declared an interim dividend of ₹24.00 per share.

Nestle India

ParticularsFY 2025-26 (Audited)FY 2024-25 (Audited)% Change (YoY)
Revenue from Operations23,154.60 Cr20,201.56 Cr+14.62%
Net Profit (PAT)3,499.08 Cr3,207.59 Cr+9.09%
Earnings Per Share (EPS)*18.15 16.63 +9.14%

Nestle India Ltd.NESTLEIND₹1,414.80 +2.53%

  • The Board has recommended a final dividend of ₹5.00 per equity share (Face Value ₹1) for FY 2025-26.
  • The company recorded a robust 14.6% increase in revenue, primarily driven by Domestic Sales, which grew from ₹19,293 Cr to ₹22,119 Cr.

Persistent Systems

ParticularsFY 2025-26 (Audited)FY 2024-25 (Audited)% Change (YoY)
Revenue from Operations14,748.45 Cr11,938.72 Cr+23.53%
Net Profit (PAT)1,865.12 Cr1,400.16 Cr+33.21%
Earnings Per Share (Basic)119.7491.22+31.27%

Persistent Systems Ltd.PERSISTENT₹5,063.10 -5.01%

  • Persistent Systems marked its 24th consecutive quarter of revenue growth, demonstrating high resilience and consistent execution in a volatile market.
  • Net profit grew significantly by 33.21%, outpacing revenue growth and showcasing improved operational leverage and efficiency.
  • The Board has recommended a Final Dividend of ₹18 per share (Face Value ₹5). 

360 One WAM

ParticularsFY 2025-26 (Audited)FY 2024-25 (Audited)% Change (YoY)
Revenue from Operations4,361.62 Cr3,370.71 Cr+29.40%
Net Profit (PAT)1,216.17 Cr1,015.30 Cr+19.78%
Earnings Per Share (Basic)30.1627.14+11.13%

360 One Wam Ltd.360ONE₹1,055.95 -4.73%

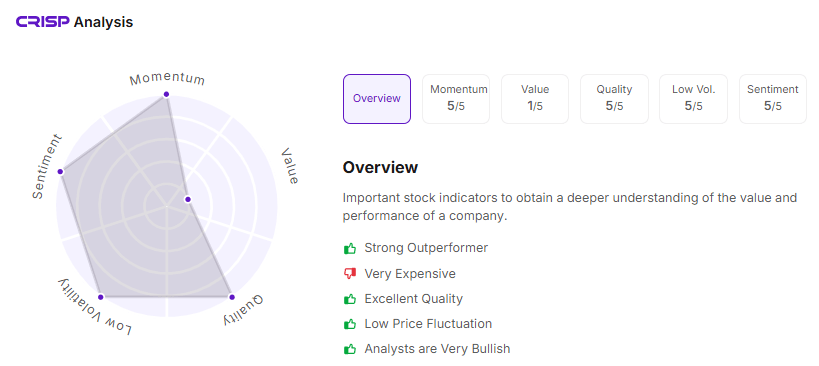
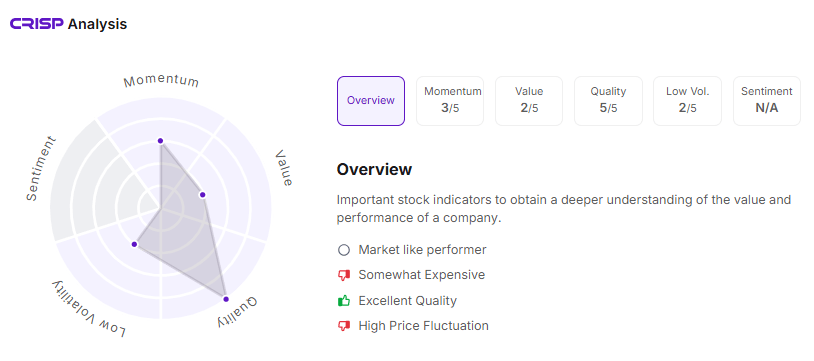
  • The company recorded a significant 29.4% increase in revenue from operations. This was primarily fueled by a jump in “Fees and Commission Income”
  • The Board has declared the first interim dividend of ₹6.00 per equity share (Face Value ₹1) for the upcoming financial year 2026-27, and has set April 27, 2026 as the record date.

Tata Investment Corporation

ParticularsFY 2025-26 (Audited)FY 2024-25 (Audited)% Change (YoY)
Revenue from Operations397.34 Cr305.08 Cr+30.24%
Net Profit (PAT)433.68 Cr312.09 Cr+38.96%
Earnings Per Share (Basic)*8.576.17+38.90%

Tata Investment Corporation Ltd.TATAINVEST₹731.00 +1.21%

  • Dividend income, the core steady revenue stream for the firm, remained healthy at ₹244.35 Crore, showing consistent growth from ₹225.44 Crore.
  • Recommended a final dividend of ₹3.40 per equity share (340%) for the financial year 2025-26. This is on the new face value of ₹1 per share.

Tata Elxsi

ParticularsFY 2025-26 (Audited)FY 2024-25 (Audited)% Change (YoY)
Revenue from Operations3,757.42 Cr3,729.05 Cr+0.76%
Net Profit (PAT)628.43 Cr784.94 Cr-19.94%
Earnings Per Share (Basic)100.89126.03-19.95%

Tata Elxsi Ltd.TATAELXSI₹4,401.90 -5.35%

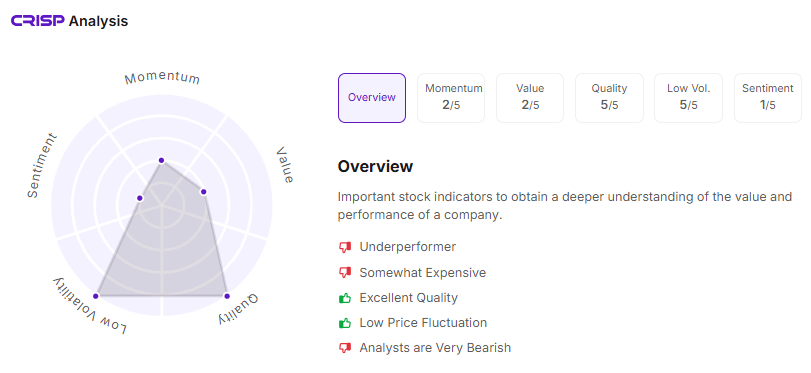
  • A significant factor in the bottom-line decline was a one-time exceptional charge of ₹95.69 Crore (9,568.88 Lakhs) due to the estimated impact of the New Labour Codes on employee benefit provisions.
  • The Board of Directors has recommended a Final Dividend of ₹75 per equity share (Face Value ₹10) for the financial year 2025-26.

Central Mine Planning & Design Institute

ParticularsFY 2025-26 (Audited)FY 2024-25 (Audited)% Change (YoY)
Revenue from Operations2,316.53 Cr2,102.76 Cr+10.17%
Net Profit (PAT)613.18 Cr666.91 Cr-8.06%
Earnings Per Share (Basic)8.599.34-8.03%

Central Mine Planning & Design Institute Ltd.CMPDI₹180.60 -2.40%

  • Despite the revenue growth, Net Profit declined by 8.06%. This was primarily driven by a significant increase in operating expenses:
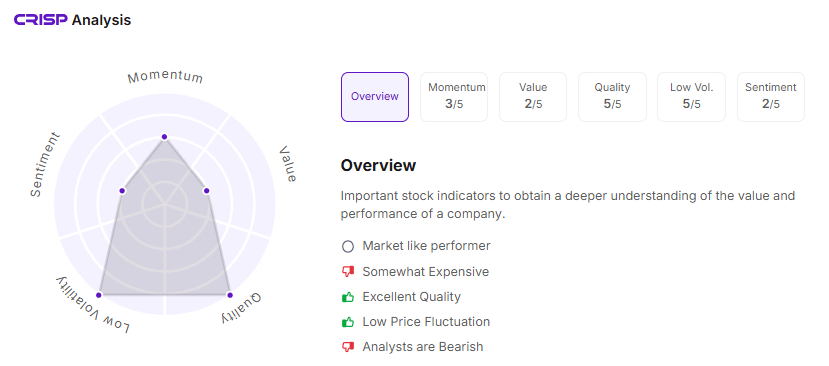
  • These results represent the first set of annual audited numbers for CMPDI following its successful listing on the Indian stock exchanges on March 30, 2026.
  • The Board of Directors has recommended a Final Dividend of ₹1.06 per equity share (Face Value ₹2) for the financial year 2025-26, subject to shareholder approval.
  • Sufficient data is yet to be available for CRISP Analysis.

Transformers & Rectifiers India

ParticularsFY 2025-26 (Audited)FY 2024-25 (Audited)% Change (YoY)
Revenue from Operations2,508.80 Cr2,019.39 Cr+24.24%
Net Profit (PAT)272.17 Cr216.43 Cr+25.75%
Earnings Per Share (Basic)9.077.21+25.80%

Transformers & Rectifiers (India) Ltd.TARIL₹304.35 -8.69%

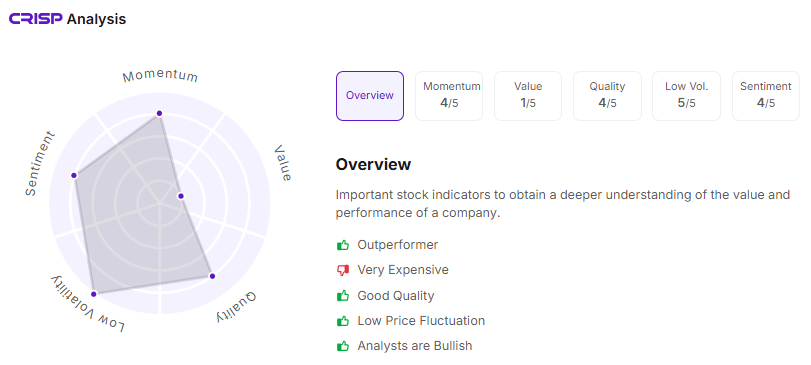
  • The revenue as well as the profit grew significantly, reflecting strong demand and operational efficiency.
  • The Board has recommended a Final Dividend of ₹0.25 per equity share (25%) on the face value of ₹1 each for the financial year 2025-26, subject to shareholder approval.