

The 3:15 PM Puzzle: How the New Closing Auction Session (CAS) is changing Expiry Day Dynamics
- Share.Market
- 5 min read
- 04 Aug 2026


The final fifteen minutes of the Indian trading session have historically been a battleground for last-minute adjustments. But with the recent introduction of the new Closing Auction Session (CAS), that battleground has turned into a minefield.
As evidenced by closing price action on 4th Aug and the 150-point closing jump that surprised traders on the Nifty expiry, the market is facing a new reality: the period between 3:15 PM and 3:30 PM is fundamentally breaking traditional option pricing models and technical indicators.
For intraday traders, option sellers, and algorithmic systems, the structural shift means the final minutes of trading are no longer about trend continuation—they are about navigating a blind, pooled order-matching black box.
The Options Pricing Paradox
The impact of the CAS mechanism was on full display during today’s expiry (August 4th) at the Nifty 24600 strike.
Under normal continuous market conditions, as an expiry approaches the final bell, At-The-Money (ATM) options experience extreme theta decay. A trader would typically expect at least one side of the ATM strike (either the call or the put) to be virtually worthless, trading at ₹0.10 to ₹0.20.
Instead, the market witnessed an unprecedented anomaly: both the Put and the Call behaved as if they were heavily in-the-money at the exact same time.
- The 24600 PE was trading around ₹55 – ₹60.
- The 24600 CE was trading between ₹10 – ₹15.
How does an option just minutes from expiration hold this much premium on both sides?
The answer lies entirely in the uncertainty created by the new CAS settlement. Because the final closing price is now determined only after collecting all buy and sell orders in the closing auction, continuous price discovery is essentially paused. Market makers and option writers are suddenly now in dark.
Uncertain of a random, CAS-driven 100+ point swing (like the 150-point Nifty jump seen recently), option sellers are aggressively expanding spreads and pricing in massive tail-risk. Until the final equilibrium price is determined by the exchange, both sides of the option chain remain inflated. Moving forward, it is to be seen whether this behaviour becomes the new normal on expiry days.
Visualizing the Anomaly: Constant Premium and the 3:25 PM Vertical Drop
A clear illustration of this structural change is visible in the intraday chart of the Nifty Straddle on today’s expiry day i.e 4th aug

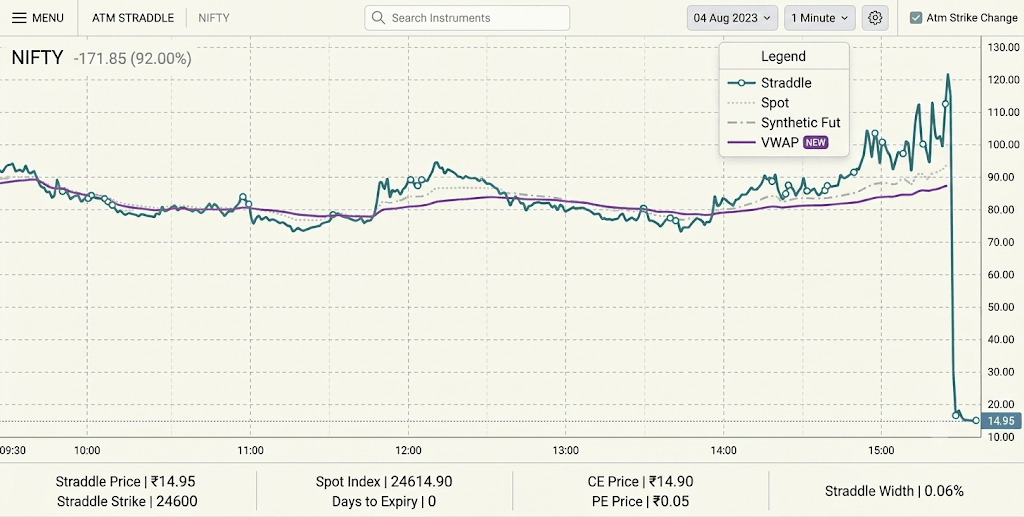
Under normal market conditions, an ATM straddle on expiry day exhibits a smooth, downward slope as time decay relentlessly eats away at extrinsic value throughout the morning and afternoon. In contrast, the chart reveals a vertical drop decay profile:
- Flatline & Padding (09:30 AM to 03:00 PM): Rather than decaying consistently, the straddle price spent almost the entire trading session oscillating between ₹80 and ₹100. Even past 2:00 PM, when theta decay should have erased more than 80% of the straddle’s value, the combined premium remained fully intact.
- Pre-Auction Spike (03:00 PM to 03:15 PM): As the market approached the 3:15 PM CAS transition window, option writers rapidly expanded risk spreads due to unpredictable closing auction gap. This pushed the straddle premium to an intraday high above ₹120 right before the end of continuous trading.
- The Cliff Drop (03:20 PM to Settlement): Once the market entered the order-accumulation phase and the continuous order book paused, the artificial premium padding vanished instantaneously. The straddle experienced a vertical cliff drop—plunging from over ₹120 directly to ₹14.95 in a matter of moments.
At the final settlement (Spot at 24614.90), intrinsic value asserted itself instantly: the 24600 CE closed at ₹14.90, the 24600 PE collapsed to ₹0.05, and the straddle width compressed to 0.06%.
This behavior proves that theta decay is no longer a smooth curve distributed across the trading session. Instead, market participants hold straddles artificially high all day to hedge against CAS settlement risk, releasing a full day’s worth of decay in a single drop at the final bell.

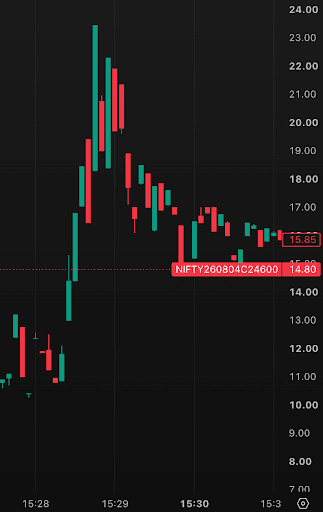

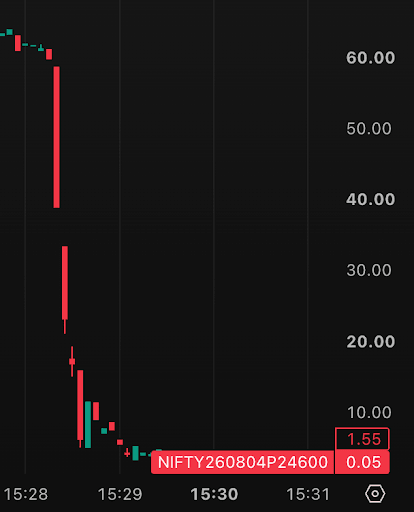
The Breakdown of Technical Indicators
This isn’t limited to the derivatives segment; it is also impacting the charts traders use to navigate the market.
During the 3:15 PM to 3:30 PM window, the transition from continuous matching to order accumulation has created volatile indicative price fluctuations. These fluctuations feed into trading platforms, causing moving averages, RSI, VWAP, and volume-based indicators to generate incorrect signals.
Algorithmic trading systems relying on these technicals are being triggered into buying or selling based on price movements that haven’t actually settled.
At Share.Market, we have made a choice to intentionally halt the display and usage of continuous price movements post-3:15 PM for technical charts. The price during the CAS window is an indicative price and not based on actual trades. By making this choice and freezing the data feed as the market enters the CAS mechanism at 3.15PM, we prevent technical indicators from behaving incorrectly, thereby protecting traders from acting on the indicative price movements generated during the auction accumulation phase rather than the actual trade data.
The New Normal for Retail Traders
The introduction of CAS is intended to reduce volatility and manipulation at the close. The market has shaken up a little with a new closing mechanism in place. As with every change, it might take some time for the markets and market participants to find a new normal at the closing.


