

Decoding Intraday Bias & Volatility with the Central Pivot Range (CPR)
- Share.Market
- 4 min read
- 14 Aug 2026


Finding true support, resistance, and daily trend directional bias is one of the biggest hurdles for intraday and swing traders. Traditional single pivot points often fail to capture the full price equilibrium zone, leading traders to enter prematurely or get trapped during choppy market conditions.
To solve this friction point, the Central Pivot Range (CPR) provides a focal structural band that establishes directional bias, forecasts session volatility, and acts as a dynamic magnet for price action.
1. The Single Pivot Problem & Market Context
When tracking market structure using standard floor pivots, traders regularly face three structural friction points:
- Static Line Vulnerability: A single, paper-thin Pivot Point (PP) often gets whipsawed back and forth by normal market noise, triggering false breakout signals.
- Lack of Volatility Context: Standard horizontal support/resistance levels fail to indicate whether the upcoming session is likely to be a trending breakout day or a range-bound consolidation day.
2. The Three-Line CPR Framework


Instead of relying on a single line, the Central Pivot Range constructs a dynamic focal band using three distinct levels calculated from the previous higher timeframe’s High (H), Low (L), and Close (C):
Central Pivot Point (CPP) ={H + L + C}
Top Central Pivot (TC ) ={H + L}
Bottom Central Pivot (BC ) = (2 * CPP) – \TC
CPR Width = |TC – BC|
Measures previous session volatility to predict upcoming market state
3. Dynamic Timeframe Rule & Indicator Configuration
To ensure accurate structural alignment, the indicator automatically applies the One-Step-Higher Timeframe Rule:
- Intraday Charts (5m / 15m / 1h): Calculates CPR using the Previous Day’s High, Low, and Close.
- Daily Charts: Calculates CPR using the Previous Week’s High, Low, and Close.
- Weekly Charts: Calculates CPR using the Previous Month’s High, Low, and Close.
- Monthly Charts: Calculates CPR using the Previous Year’s High, Low, and Close.
Indicator Inputs & Style Options

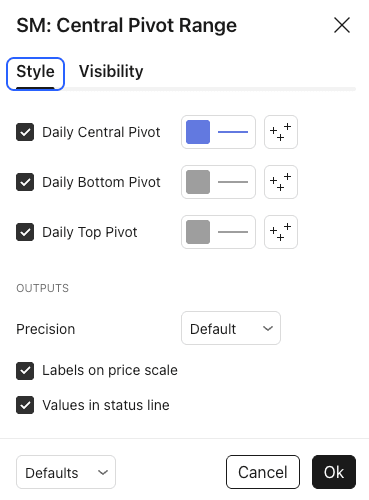
On Share.market, the indicator defaults to displaying the primary three-line CPR band (CPP, UPP, LPP) for a clean visual presentation:
- Daily Central Pivot (CPP): Middle line (Brown)
- Daily Top Pivot (TC ): Top line (Blue)
- Daily Bottom Pivot (BC): Bottom line (Purple)
- Optional Layers: Users can toggle additional standard Resistance (R_1, R_2, R_3, R_4) and Support (S_1, S_2, S_3, S_4) lines as required for multi-target planning.
Market Analysis & Trading Applications
The CPR provides two powerful diagnostic insights before a single trade is taken: Trend Bias and Volatility Forecasting
1. Volatility Forecasting via CPR Width
- Narrow CPR: Indicates that the previous session had low volatility and tight consolidation. A narrow CPR signals a high probability of a strong breakout or trending session next.
- Wide CPR: Indicates high volatility and large range expansions in the previous session. A wide CPR suggests the current session is likely to be range-bound or choppy
2. General Price Action Scenarios
- Bullish Expansion Scenario: When the market opens or moves above the CPR band and sustains upward momentum, the top boundary (TC) acts as dynamic support during minor pullbacks. Holding above the CPR band confirms active buyer control.
- Bearish Breakdown Scenario: When price trades or breaks cleanly below the CPR band, the CPR acts as overhead resistance. Any retracements back into the lower pivot boundary (BC) tend to encounter selling pressure, keeping the market bias firmly bearish.
- Reversion to Magnet Zone: When price opens extended or far away from the CPR, it frequently treats the three-line band as a magnet zone, reverting to test the range before committing to its next directional trend
Conclusion
SM: Central Pivot Range—available on Share.market—represents one of many technical frameworks available to evaluate market structure. Like any technical analysis tool, the CPR is not a guaranteed predictor of price movement or a standalone system. Instead, it serves as an objective reference point to help traders organise price action, assess potential trend bias, and gauge session volatility. Incorporating risk management and combining CPR analysis with price action confirmations or broader market context remains essential for any disciplined trading strategy.


