

Beyond the Standard RSI: How ” Two RSI Crossover” Solves Momentum Lag for Traders
- Share.Market
- 4 min read
- 12 Aug 2026


This custom SM: RSI Crossover analytical tool is exclusively available on the Share.market platform.
The Relative Strength Index (RSI) is a staple on millions of trading charts worldwide. However, modern market dynamics reveal critical limitations in how standard single-line indicators handle speed, velocity, and momentum shifts. To solve these friction points, we designed a simple, high-precision momentum tool: SM: RSI Crossover (Fast RSI: 5, Slow RSI: 14).
1. The Standard RSI & The Retail Trader Problem
The classic 14-period RSI measures the speed and change of price movements on a scale from 0 to 100. Typically, values above 70 indicate overbought conditions, while values below 30 indicate oversold conditions.
Despite its popularity, traders regularly face three major structural issues when relying on traditional RSI setups:
- The “Pinned Indicator” Problem: During strong, sustained trends, price momentum keeps a single RSI trapped above 70 or below 30 for extended periods. Traders who blindly sell overbought conditions or buy oversold conditions end up trading directly against powerful institutional momentum.
- Lag in Spotting Reversals: Because a standalone 14-period RSI is a smoothed trailing calculation of price, it reacts slowly when momentum begins to fade. By the time a single RSI line turns around, a significant portion of the price move has already passed.
- Lack of Clear Signal Triggers: A single RSI line moving up or down does not give an objective entry trigger; traders are left guessing whether a move is a real trend continuation or a weak bounce.
2. The Solution: Fast RSI(5) vs. Slow RSI(14) Crossover
To fix these problems, we plot two distinct RSI lines together: a Fast RSI (5-period) and a Slow RSI (14-period). The indicator calculates the interaction between short-term momentum and medium-term trend strength, displaying it as a clean, colour-coded visual wave.
| Indicator Component | Configuration | Primary Purpose |
| Fast RSI | 5 Length | Reacts rapidly to immediate short-term price velocity. |
| Slow RSI | 14 Length | Establishes macro momentum context and baseline direction. |
| Crossover Output | Green / Red Line | Positive (Green): Fast RSI(5) crosses ABOVE Slow RSI(14) Negative (Red): Fast RSI(5) crosses BELOW Slow RSI(14) |
How the Crossover Works
- Bullish Crossover (Green): When the fast RSI(5) crosses ABOVE the slow RSI(14), short-term momentum is accelerating faster than the baseline trend. This signals an immediate bullish entry/continuation.
- Bearish Crossover (Red): When the fast RSI(5) crosses BELOW the slow RSI(14), short-term momentum is breaking down faster than the baseline trend. This signals a bearish exit or short-entry trigger.
3. Indicator Settings & Configuration
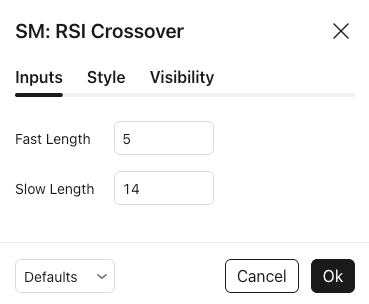
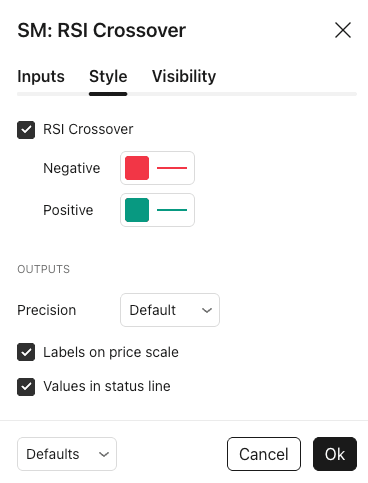
As shown in the indicator setup dialogues, the configuration is kept straightforward for maximum efficiency across all timeframes:


Inputs Tab
- Fast Length: 5 (Tracks immediate speed changes)
- Slow Length: 14 (Tracks baseline market strength)
Style Tab
- RSI Crossover:
- Positive (Green): Active when RSI(5) > RSI(14) (Bullish state).
- Negative (Red): Active when RSI(5) < RSI(14) (Bearish state).
- Display Elements: Labels on price scale and Values in status line enabled.
4. Practical Trading Applications: NIFTY 50 Real Market Examples
Bullish Crossover Example (NIFTY 50 Upward Move)


- Setup: NIFTY 50 consolidates or completes a minor dip (e.g., near the 23,800 level on 24 th June).
- Signal: The fast RSI(5) crosses ABOVE the slow RSI(14). On the indicator pane, the line transitions from a deep red valley and flips Green.
- Observation: Enter long on the candle close following the green crossover. As price rallies towards 24,200, the indicator remains solidly green, allowing you to ride the full upward trend without getting shaken out early.
Bearish Crossover Example (NIFTY 50 Downward Move)


- Setup: NIFTY 50 rallies into resistance near 24,500.
- Signal: Short-term buying speed dies out, causing the fast RSI(5) to cross BELOW the slow RSI(14). The indicator pane flips Red.
- Observation: The red transition indicates that downside velocity has surpassed baseline momentum, signalling a potential pullback before a major price decline occurs.
Conclusion
The SM: RSI Crossover—available exclusively on Share.market—simplifies momentum analysis. By measuring the interaction between a fast and slow RSI period, traders gain an objective visual tool to evaluate trend strength, detect velocity shifts, and refine their overall market analysis across various periods and timeframes.


