

Mastering Dynamic Range Breakouts: How “SM: Prev High Low” Automates Price Action Analysis
- Share.Market
- 4 min read
- 12 Aug 2026


Price action trading revolves around the core principle of tracking session highs and lows. For traders who base their strategy on pure price movement, knowing exactly where the market established its previous extremes is critical. However, manually drawing horizontal lines every time a new session develops is inefficient and prone to subjective errors.
The SM: Prev High Low indicator—automatically calculates and projects key session boundaries and multi-period lookbacks directly onto your chart in real time.
1. The Real Friction Points in Pure Price Action Trading
When trading price action based on session highs and lows, traders regularly face three major friction points:
- Manual Charting Fatigue & Human Error: Manually drawing and shifting range levels across multiple session lookbacks continuously consumes time and leads to inaccurate placement during fast-moving market hours.
- Static Line Blindness: Standard horizontal lines drawn at a single point in time fail to adapt dynamically as new session data prints, making it difficult to visualize expanding or contracting consolidation ranges.
- Breakout Uncertainty: Without clear, multi-layered lookback boundaries, price action traders struggle to identify whether a move out of a session high/low is a genuine range breakout or a temporary fakeout within a broader lookback period.
2. The Solution: Automated, Dynamic Range Plotting
For traders following price action, the high and low of any given session represent the ultimate battlegrounds between buyers and sellers. The SM: Prev High Low indicator automates this entire process by continuously projecting dynamic range boxes based on your chosen frequency and lookback windows.
| Lookback Range | Default Parameters | Price Action Function |
| Range 1 (Green) | Lookback: 7 | Projects short-term session highs/lows for quick breakout entries. |
| Range 2 (Blue) | Lookback: 15 | Defines medium-term consolidation ranges and equilibrium zones. |
| Range 3 (Orange) | Lookback: 30 | Establishes macro high/low boundaries for major structural breakouts. |
Why It’s the Ultimate Price Action Tool
Instead of drawing fixed rectangular boxes by hand, this tool plots dynamic ranges that update automatically with every new hourly or daily bar.
- Automatic Range Construction: You never have to manually draw box patterns or identify consolidation boundaries—the indicator maps the precise upper resistance and lower support bands for you.
- Pure Price Action Integration: It respects pure market structure without adding lagging oscillators or moving averages onto your price candles.
- Instant Breakout Context: When price breaks out of the plotted range boundaries, it instantly signals an expansion phase, giving price action traders a clear, objective trigger.
This custom SM: Prev High Low analytical tool is exclusively available on the Share.market platform.
3 Indicator Settings & Parameter Customisation (Multi-Timeframe Flexibility)

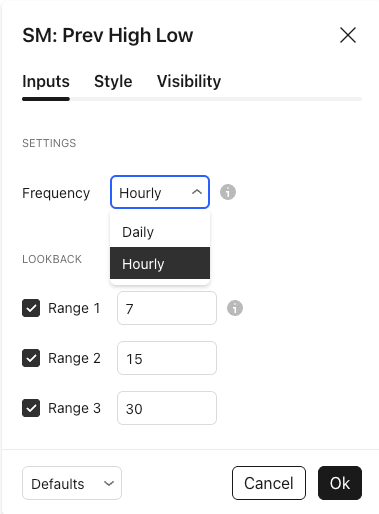
The SM: Prev High Low indicator features full parameter flexibility, allowing you to tailor the lookback periods and reference timeframes to your exact trading style:
- Frequency Selection (Daily vs. Hourly): You can set the reference frequency independently of your active chart timeframe. For instance, you can trade on a 5-minute intraday chart, but if you select the Hourly frequency, the indicator will project the exact highs and lows calculated from hourly sessions onto your 5-minute candles. Selecting Daily will project daily lookback highs and lows regardless of how low your chart timeframe is.
- Customizable Lookback Ranges: Adjust the lookback inputs (Range 1, Range 2, Range 3) to track short, medium, or long-term session boundaries based on your strategy (e.g., 7, 15, or 30 periods).
Traders are encouraged to test different frequency and lookback combinations across execution timeframes to find the optimal consolidation boundaries for their trading instruments.
Conclusion
For traders who rely on session highs, session lows, and structural price action, the SM: Prev High Low—available exclusively on Share.market—is an essential charting companion. By allowing you to customise lookback periods and overlay higher-timeframe frequencies (like Hourly or Daily levels on a 5-minute chart), it replaces manual drawing with dynamic, auto-updating range boundaries.
This empowers you to spot high-probability range breakouts, monitor consolidation phases, and read pure price action with total efficiency across any execution timeframe.


