
Beta Meaning in Stock Market: High Vs. Low Beta Stocks
- Share.Market
- 4 min read
- 13 Apr 2026


Highlights
- Learn the meaning of beta in the stock market: a measure of stock volatility compared to the Nifty or Sensex benchmarks
- Understand the beta formula: how covariance and variance determine whether stocks move more or less than the market
- Compare high beta stocks (technology, commodities) and low beta stocks (FMCG, utilities) for portfolio balance
- Discover how beta differs from alpha and why both metrics matter for risk-adjusted returns
Introduction
You’ve probably noticed that during market corrections, some stocks drop 15% while the Nifty falls only 10%. Others barely budge. That difference isn’t random. It’s captured by a metric called beta, which measures how sensitive a stock is to overall market movements. For investors building portfolios, understanding the meaning of beta in stock market terms helps match stock selection to risk appetite.
What is Beta in the Stock Market?
Beta measures how much a stock’s price moves relative to the broader market. Beta quantifies how sensitive a stock or portfolio is to systematic market risk compared to the broader market. In India, this market is typically the Nifty 50 or Sensex.
The baseline is beta = 1.0, meaning the stock moves exactly in line with the market. If Nifty rises 10%, a stock with a beta of 1.0 also rises ~10%. A beta above 1.0 signals higher volatility. A beta of 1.5 stock moves 50% more than the market (15% when Nifty moves 10%). A beta below 1.0 indicates defensive behaviour. A beta of 0.5 stock moves half as much (5% when Nifty drops 10%).
Beta Formula: How is Beta Calculated?
Beta = Covariance (Stock, Market) / Variance (Market)
Covariance measures how the stock and market move together; positive covariance means they generally move in the same direction.
Variance captures market volatility itself. Dividing covariance by variance isolates the stock’s sensitivity to market swings.
If a stock with a beta of 1.2 gives a 15% return while the Nifty returns 10%, it may be generating positive alpha, meaning it performed better than expected for its level of risk.
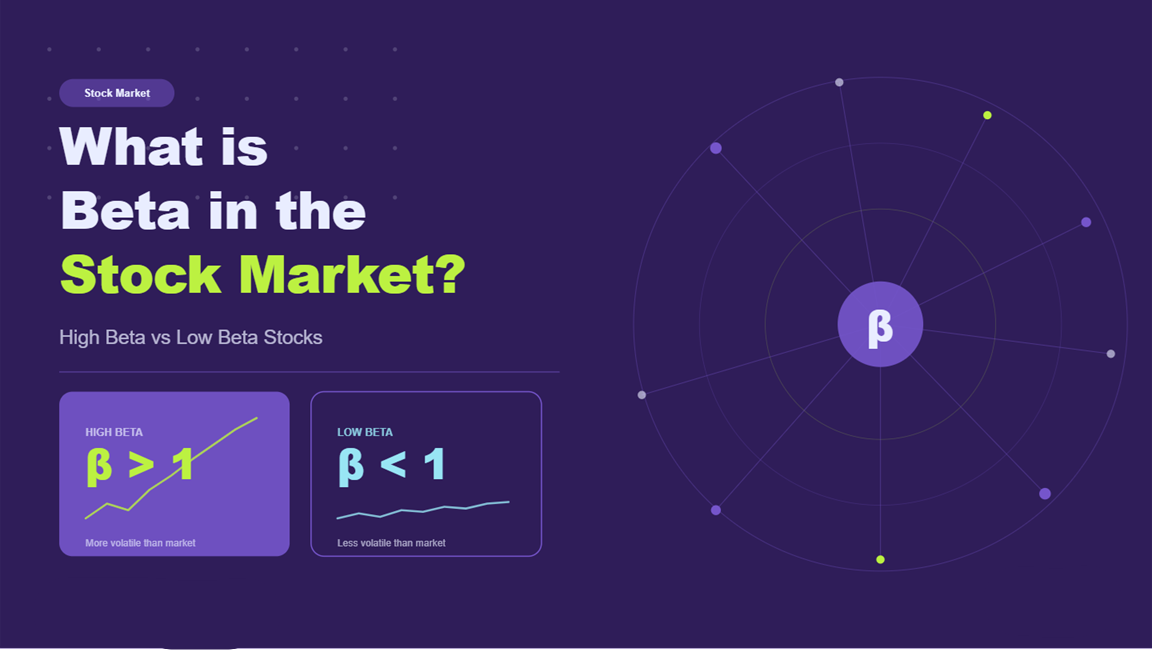
High Beta Vs. Low Beta Stocks
High beta stocks (beta >1.0) amplify market movements. They’re concentrated in cyclical sectors like auto, metals, infrastructure and real estate. NSE tracks these through the Nifty High Beta 50 index, capturing the top 50 volatile stocks. High beta suits aggressive investors during bull markets but magnifies losses in downturns.
Low beta stocks (beta <1.0) are defensive. They’re found in consumer staples (Hindustan Unilever), utilities (NTPC), and pharma sectors with consistent demand regardless of economic conditions. When Nifty drops 10%, low beta stocks might fall only 5-7%. They underperform in rallies but cushion portfolios during corrections.
Sector classification:
- High beta: Technology, auto, metals, real estate
- Low beta: FMCG, pharma, utilities
Beta Vs. Alpha: What’s the Difference?
Alpha measures how much an investment outperforms its benchmark, showing its performance. Beta measures how much the investment’s price moves compared to the overall market, indicating its level of risk. A positive alpha means the investment has performed better than the benchmark, while a beta greater than 1 means it is more volatile than the market. In simple terms, alpha reflects the extra value generated by the fund manager or strategy, whereas beta reflects exposure to market risk.
A stock with a beta of 1.2 delivering a 15% return when the Nifty returned 10% may indicate positive alpha if it performs better than expected for its higher level of risk. On the other hand, a stock with a beta of 0.8 returning 6% when the Nifty delivered 10% may reflect negative alpha, indicating underperformance.
In simple terms, beta measures a stock’s exposure to market volatility, while alpha shows how much it outperforms expectations. Both are important. Beta helps assess risk, and alpha helps evaluate the effectiveness of stock selection or fund management.
Your Risk Appetite, Your Beta Choice
Beta isn’t inherently good or bad; it’s a risk gauge. Conservative investors building retirement portfolios favour low beta stocks for stability. Aggressive investors chasing growth accept high beta volatility. The key is alignment: match beta to your time horizon, risk tolerance, and market view. Beta reveals what you’re signing up for when you buy a stock.
FAQs
Beta measures stock volatility relative to the market (Nifty/Sensex). Beta 1.0 = market-aligned; >1.0 = more volatile; <1.0 = less volatile. It’s a systematic risk metric.
Beta = Covariance (Stock, Market) / Variance (Market). It uses statistical measures, covariance (how stock moves with the market) divided by variance (market volatility).
High beta (>1.0) stocks are volatile tech, commodities move more than the market. Low beta (<1.0) stocks are defensive; FMCG and utilities move less. Risk-reward scales with beta.
NSE tracks the Nifty High Beta 50 index with the top 50 volatile stocks. High beta stocks come from cyclical sectors like auto, metals, and infrastructure sensitive to economic changes.
Beta measures market risk/volatility (how the stock moves with the market). Alpha measures performance (excess return vs benchmark). Beta = risk metric; alpha = skill/outperformance metric. Both assess investments differently.


