

What is a Morning Star Pattern: Meaning and Significance
- Share.Market
- 12 min read
- 23 Oct 2025


In technical analysis, patterns are often the hidden language of the market. One such pattern, the Morning Star, acts like an early signal that a downtrend might be coming to an end. Traders often treat this as a sign to prepare for a potential bullish move.
In this article, you’ll learn what a Morning Star candlestick pattern is, how it works, and why it matters for spotting potential trend reversals.
What is a Morning Star Pattern?
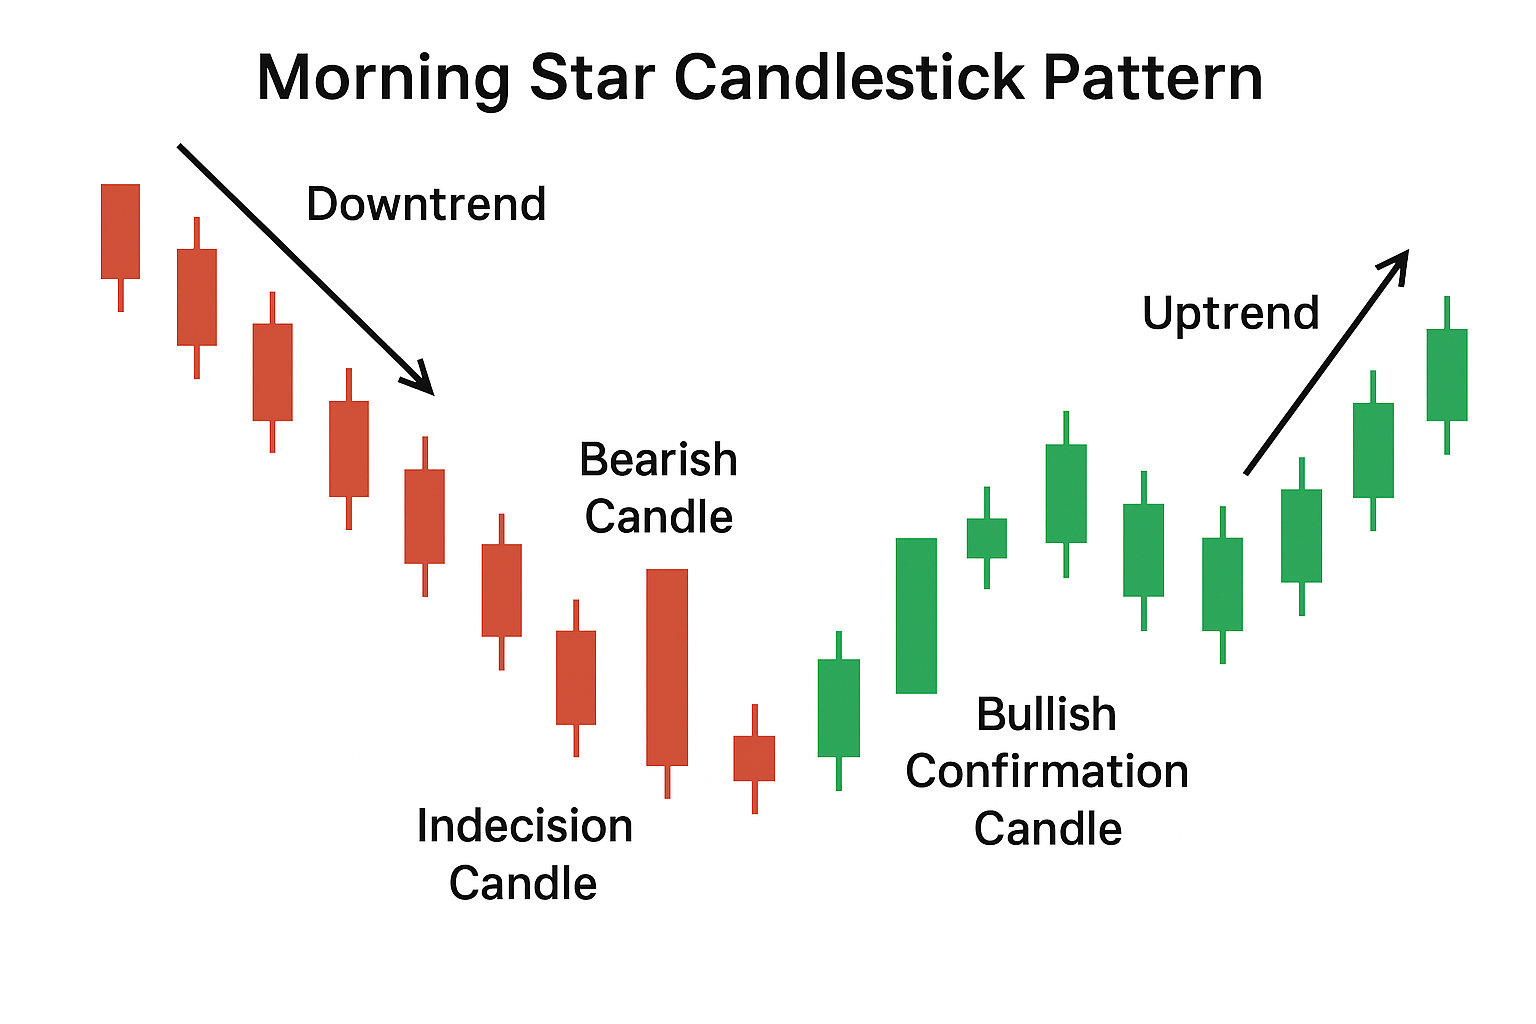
The Morning Star pattern is a three-candle formation that signals a possible shift from a downtrend to an uptrend. It is seen at the bottom of a bearish chart and is considered a strong indication of a potential reversal.
The pattern starts with a long red candle, showing that sellers are in control. The second candle is small and can be either red or green. It reflects indecision in the market. The third candle is a long green one, which confirms that buyers are taking over.
Take a look at the chart below to see how the Morning Star candlestick pattern forms during a trend reversal.

This pattern is important because it shows a clear change in market mood. Traders use it to identify entry points in bullish trades, especially when supported by volume or other indicators.
When spotted correctly, it can offer a strong signal for a recovery in price.
Components of the Morning Star Pattern
The Morning Star candlestick pattern is made up of three distinct candles, each offering valuable insight into market behaviour. To understand how this pattern works, it’s important to look at what each candle represents and how the shift in sentiment unfolds.
1. First Candle: A Strong Bearish Move
The first candle in a Morning Star candlestick pattern shows strong selling pressure. It is large and red, forming during a clear downtrend. This candle reflects bearish control, where sellers dominate the market and push prices lower. It sets the stage for a possible shift in momentum in the following sessions.
2. Second Candle: A Pause or Sign of Indecision
The second candle shows the market slowing down after a strong fall. It has a small body, meaning prices didn’t move much. This pause hints at uncertainty among traders. When this candle appears as a doji, it’s called a morning star doji candle, often signalling a shift in market direction.
3. Third Candle: The Bullish Confirmation
The third candle shows strong buying pressure and usually opens above the second candle’s close. It closes deep into the body of the first candle, confirming a shift in trend. This final move makes the Morning Star one of the most trusted bullish reversal candlestick patterns for traders watching market momentum.
Psychology Behind the Morning Star Pattern
When traders see a Morning Star pattern on the chart, they are watching a shift in market emotion. It is not just about the shape of the candles. It is about what those candles are telling us about buyers and sellers.
In a falling market, sellers are confident. They believe prices will keep going down, so they continue selling aggressively. That is what the first long red candle represents. It shows strong selling pressure with very little hope for buyers.
But the next day, things start to change. The market opens and closes at nearly the same price. This creates a small candle that looks like a pause. It means traders are unsure. Sellers are losing confidence, and buyers are not yet fully convinced to enter. This is a moment of balance, where no one is clearly in control.
On the third day, buyers finally gain confidence. The price opens higher and closes even higher, forming a strong green candle. This shows that buyers have stepped in with strength and are ready to turn the trend around. It reflects a positive shift in sentiment and a potential move upward.
This entire pattern captures the emotional journey of the market from fear and selling to hesitation and finally hope.
Why is the Morning Star Pattern Important for Traders?
A Morning Star pattern holds strong importance for traders because it signals a possible shift from a downtrend to an uptrend. Here’s why this pattern matters in trading:
1. Reversal Confirmation
The first candle in the Morning Star shows heavy selling, but the second and third candles tell a different story. When the last candle closes above the halfway mark of the first one, it confirms buyers are stepping in.
This makes the Morning Star trading pattern a strong signal that the downward trend might be ending soon.
2. Early Entry Opportunity
The Morning Star pattern gives traders a chance to buy early, right when a downtrend might be ending.
For example, if a stock has been falling for days and then forms this pattern, you can enter a trade when the third candle closes on a strong note. This way, you catch the trend early before prices rise further.
3. Defined Risk Management
This pattern helps traders manage risk in a clear and simple way. When the pattern forms, it shows a possible turning point in the market. Traders can place a stop-loss just below the low of the second candle.
This level acts as a safety net if the price moves in the wrong direction. Because the pattern signals a likely reversal, it allows for better planning of entry and exit points. This makes it easier to trade with a healthy risk-to-reward ratio and more confidence.
4. Works Across Markets
The Morning Star pattern works well across different markets like stocks, forex, or gold. Whether you use daily or weekly charts, the pattern remains useful for spotting trend reversals.
It is a reliable part of share market candle chart study, helping traders understand when prices might stop falling and start rising, no matter the asset or timeframe.
5. Higher Probability Setup
When combined with confirmation tools like high volume, RSI signals, or support levels, the Morning Star becomes more reliable.
These extra checks help you trust the pattern more. It means the chances of the price moving up are higher. Traders often see strong gains after this setup because it clearly shows buyers are taking control.
6. Volume Confirmation
Volume plays a key role in confirming the strength of any candlestick pattern. When the morning star chart pattern forms with a noticeable rise in volume on the third candle, it signals genuine buying interest. This shift in volume helps confirm that sellers are losing control and buyers are stepping in.
It builds trust in the pattern and gives them more confidence before entering a trade or making any important decision based on the signal.
What is the Difference Between Morning Star vs. Evening Star?
The Morning Star and Evening Star are both types of star candlestick patterns that help traders understand when a trend might be about to reverse. While one signals a possible rise in price, the other hints at a possible fall.
Knowing the difference between the two can help you make better trading decisions, especially when you’re watching for shifts in market direction. Here’s a simple table that breaks down how they differ:
| Point of Comparison | Morning Star Pattern | Evening Star Pattern |
| Market Signal | The Morning Star pattern is a bullish reversal signal. It often appears after a downtrend and suggests that buyers may take control. | The Evening Star pattern is a bearish reversal signal. It usually forms after an uptrend and hints that sellers might gain control. |
| Sequence of Candles | It has three candles: first a long red (bearish) candle, then a small candle (often a doji), followed by a long green (bullish) candle. | It also has three candles: first a strong green (bullish) candle, then a small candle, followed by a long red (bearish) candle. |
| Location on the Chart | This pattern appears at the bottom of a price trend, signalling a possible upward move. | This pattern shows up at the top of a price rally, pointing to a possible downward move. |
| Sentiment Shift | It shows a shift from selling pressure to buying strength, indicating recovery. | It reflects a change from buying enthusiasm to selling pressure, suggesting a pullback. |
| Trading Action After Pattern | Traders often look for confirmation and may enter long positions (buy) if the trend starts rising. | Traders may look for signs to sell or short the stock when they see this pattern confirmed. |
| Ideal for Which Trend | Ideal for spotting the end of a downtrend. | Ideal for spotting the end of an uptrend. |
Are There Any Limitations of the Morning Star Pattern?
Yes, here are the key limitations of using the Morning Star pattern in trading:
1. Subjective Identification
Subjective identification means different traders may see the same chart differently. What looks like a proper morning star pattern to one person might not be convincing to another. This happens because candle sizes, gaps, or trend strength can vary.
2. Context Sensitivity
This pattern only works well when it appears after a clear downward trend. If the market is moving sideways or there’s no strong selling before it forms, the pattern loses its meaning. Without a proper downtrend, the Morning Star may not signal a real reversal. It’s important to check the overall trend first, or else you might mistake a random move for a genuine shift in market direction.
3. Need for Confirmation
Relying on the pattern alone is risky. The Morning Star may look promising, but without confirmation, it can mislead you. Traders should wait for extra signs like rising volume, bullish indicators, or a strong follow-up candle before acting.
Just like with the evening star candlestick pattern, which also needs confirmation, using extra tools reduces false signals and helps you make smarter decisions in changing market conditions.
How to Trade the Morning Star Pattern?
We just looked at the limitations of the Morning Star pattern, but despite those, it still offers a strong indication of reversal when used the right way. Now, let’s understand how you can actually trade this pattern step by step.
1. Spot a Downtrend
To trade a Morning Star pattern, the first thing you need to do is spot a clear downtrend. This means the price should be falling steadily over several candles or days.
A Morning Star only makes sense when it appears after sellers have been in control for a while. If the market is moving sideways or already rising, the pattern loses its meaning. Always check the recent price direction before considering this pattern as a signal for a reversal.
2. Identify the Three Candles
In the second step, you need to carefully check if all three candles of the pattern are forming correctly.
- The first one should be a long red candle, followed by a small candle that shows market hesitation.
- This second one is often called a morning star doji candle, which signals a possible reversal.
- The third candle must be a strong green one that closes higher, showing buyers are stepping in confidently.
3. Evaluate Pattern Variations
There are two common Morning Star variations.
In the Doji Morning Star, the second candle is a doji, meaning the market is unsure. This version is often stronger. For example, if after a long red candle, you see a doji followed by a strong green candle, it’s a Doji Morning Star.
In the classic version, the middle candle is not a doji but just a small-bodied candle. It still shows indecision, just not as sharply. This version is also valid and reliable, especially when confirmed with other indicators like volume or support levels.
4. Look for Confirmation
After spotting the pattern, don’t rush into the trade. Wait for signs that buyers are truly in control.
For example, if the third candle forms with high volume and closes well into the first candle’s body, that’s a strong signal.
You can also check if RSI is rising from below 30 or if the price is near a known support level. These signs confirm the reversal is likely real.
5. Plan the Trade
Once the Morning Star pattern is confirmed, you can enter the trade at the opening of the next candle. Make sure the third candle closes above the midpoint of the first one. Set a stop-loss just below the lowest point of the middle candle to manage risk.
This entry strategy is also useful when trading reversals during volatile periods, like after a weak IPO debut that begins recovering strongly.
6. Manage the Trade
Once you enter the trade, keep an eye on how the price moves. If the price keeps going up after the third candle, that’s a good sign. You can adjust your stop-loss upward to lock in profits. But if the price starts to fall or struggles near resistance, consider closing the trade.
Managing the trade well helps you protect your gains and avoid unexpected losses.
7. Keep Risk in Check
Trading the Morning Star pattern works best when you manage your risk smartly. Always confirm the pattern with tools like volume or RSI to avoid false signals.
Don’t trade a major part of your capital in one trade. Also, use proper position sizing so that if the trade goes wrong, your loss is small.
Conclusion
The Morning Star pattern is a helpful tool for spotting trend reversals in the stock market. While it gives strong signals, it’s best to use it with other indicators to stay safe. Practice reading charts and managing risk before relying on any one pattern. Over time, this will sharpen your trading decisions and build confidence.
Looking to act on your analysis? Start your investing and trading journey today by opening a demat and trading account with Share.Market and begin building your portfolio.
FAQs
Yes, it can form on intraday charts like 5-minute or 15-minute timeframes. However, patterns on higher timeframes often give stronger and more reliable signals for trend reversal.
A gap adds strength, but it is not always necessary. Many times, the Morning Star patterns work without gaps, especially on shorter timeframes or in markets like forex, where gaps rarely appear.
Yes, higher volume on the third candle supports the pattern’s strength. It shows strong buying interest, which helps confirm that the trend is likely to reverse upward.
Yes, it can appear, but it is less effective. The pattern works best after a clear downtrend. In sideways markets, signals are weaker and may not lead to strong moves.
Traders wait for confirmation, like a strong green candle or support level, before entering. They also use stop-loss orders and combine the pattern with other tools like RSI or MACD.
The best way is to wait for the third candle to close above the first candle’s midpoint. Traders also use indicators like volume, RSI, or trendlines for added confirmation.
No, it’s better to use it with other indicators like trendlines or support levels. This helps confirm the signal and reduces the risk of making wrong trade decisions.


