

Average Directional Index (ADX): Meaning, Calculation & How to Use It
- Share.Market
- 8 min read
- 22 Oct 2025


If you’ve ever wondered whether the market is actually trending or just moving sideways, the Average Directional Index (ADX) can help you figure that out. It doesn’t tell you where prices are headed next, but it does show you how strong the current trend is, whether it’s up or down.
So, if you’re trying to understand whether there’s real momentum behind a price move, ADX is a great tool to have on your chart.
What is the Average Directional Index (ADX)?
The Average Directional Index (ADX) is a technical indicator used by traders to gauge how strong a market trend is, without revealing whether the trend is upward or downward.
Developed by J. Welles Wilder, ADX works alongside two other lines: the Positive Directional Indicator (+DI) and the Negative Directional Indicator (-DI). Together, they help you spot whether the market is trending, how strong that trend is, and who’s in control, buyers or sellers.
What Makes Up the ADX and How Do You Read It Right?
When you look at the ADX on your chart, you’re not just looking at one line, but you’re looking at a small system working together to tell you the whole story of a trend.
This system has three key lines:
- ADX (Average Directional Index): This indicator tells you how strong the trend is, but it is important to note that it doesn’t indicate the direction. A high ADX value means a strong trend and a low value means the market isn’t really trending at all. It could be moving sideways.
- +DI (Positive Directional Indicator): This line tracks the strength of upward moves. If it’s above the -DI line, buyers (or bulls) are in control.
- -DI (Negative Directional Indicator): This one shows the strength of downward moves. When it’s above the +DI line, sellers (or bears) are leading the way.

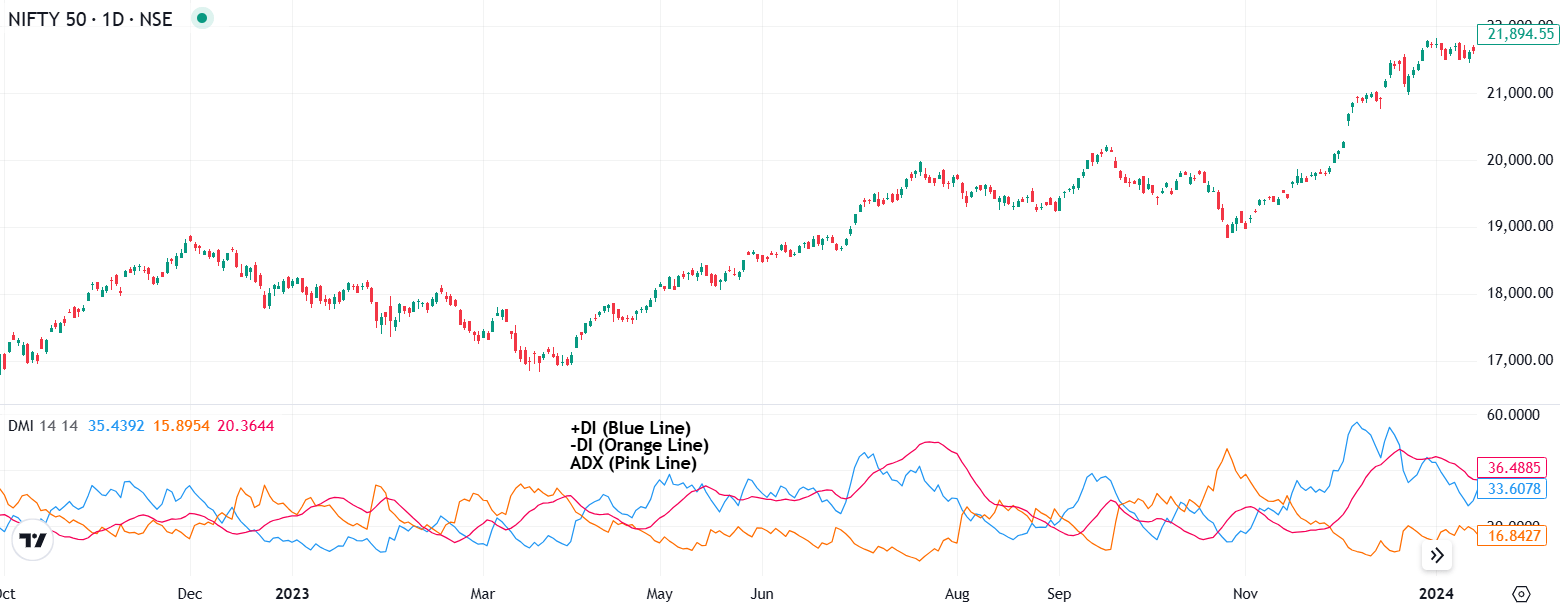
Together, the +DI and -DI lines help you spot who’s in control, buyers or sellers, while the ADX tells you how strong that trend really is.
Why Doesn’t ADX Show Direction?
Here’s where a lot of traders (especially newer ones) get tripped up: the ADX doesn’t care about direction. It only measures strength.
So, if the ADX line is going up, it doesn’t necessarily mean prices are rising. It simply means the market is trending more strongly, whether that trend is upward or downward.
That’s why you should always look at the ADX alongside the +DI and -DI lines:
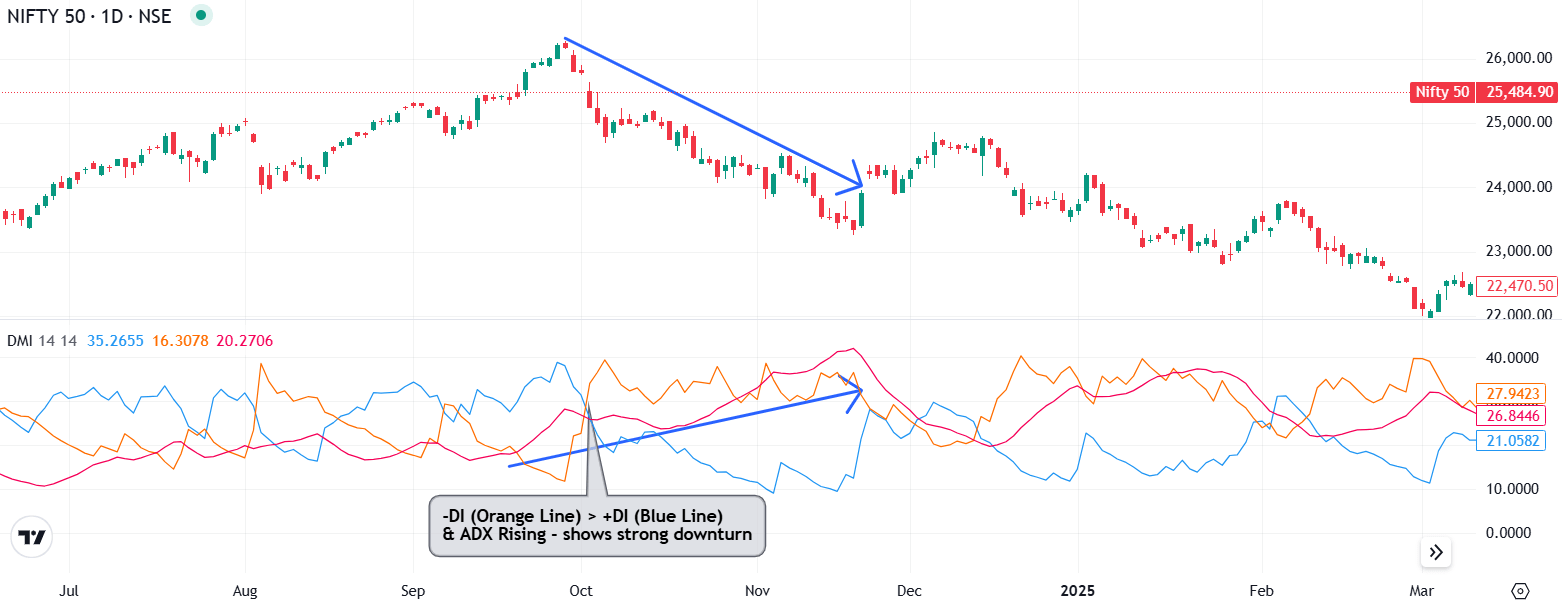
- If +DI is above -DI and the ADX is rising, you’re likely in a strong uptrend.


- If -DI is above +DI and the ADX is rising, that points to a strong downtrend.

In short, ADX is best used as a confirmation tool. Once you know the direction using +DI and -DI, ADX tells you how much strength is behind that move, helping you trade with more confidence and less guesswork.
What Do ADX Values Really Mean?
The average directional index line runs on a scale from 0 to 100.
| ADX Value Range | Trend Strength Interpretation | Market Condition Implication |
| 0-20 | Weak or Absent Trend | Sideways/Consolidation, avoid trend-based strategies |
| 20-25 | Emerging Trend | Watch for confirmation of directional movement |
| 25-50 | Moderately Strong Trend | Healthy, tradeable trend, trend-following opportunities |
| 50-75 | Strong Trend | Robust directional movement, strong trend confirmation |
| 75-100 | Extremely Strong Trend | Very powerful and sustained directional movement |
When the ADX line is rising, it means the current trend is picking up steam, and momentum is building. On the other hand, if the ADX is falling, it suggests that the trend may be losing strength, possibly heading toward a slowdown or even shifting into a sideways, range-bound market.
What Happens When You Combine ADX with +DI and -DI?
Now, here’s where things really come together: When you look at ADX alongside the +DI and -DI lines, you get the full picture. Say ADX is rising above 25, and +DI is leading; that’s a strong uptrend and a green light for long trades. If ADX is climbing and -DI is on top, that’s your cue for a possible downtrend and maybe a short trade setup.
Also, keep an eye on how far those DI lines are from each other: If they’re pulling apart, ADX usually moves up, too, telling you the trend is gaining strength. But if they start getting closer, it often means the trend is losing steam and ADX drops. Watching these dynamics together can really help you avoid second-guessing your trades.
How to Use the Average Directional Index?
Here’s how you can use ADX for more advanced and practical trading strategies:
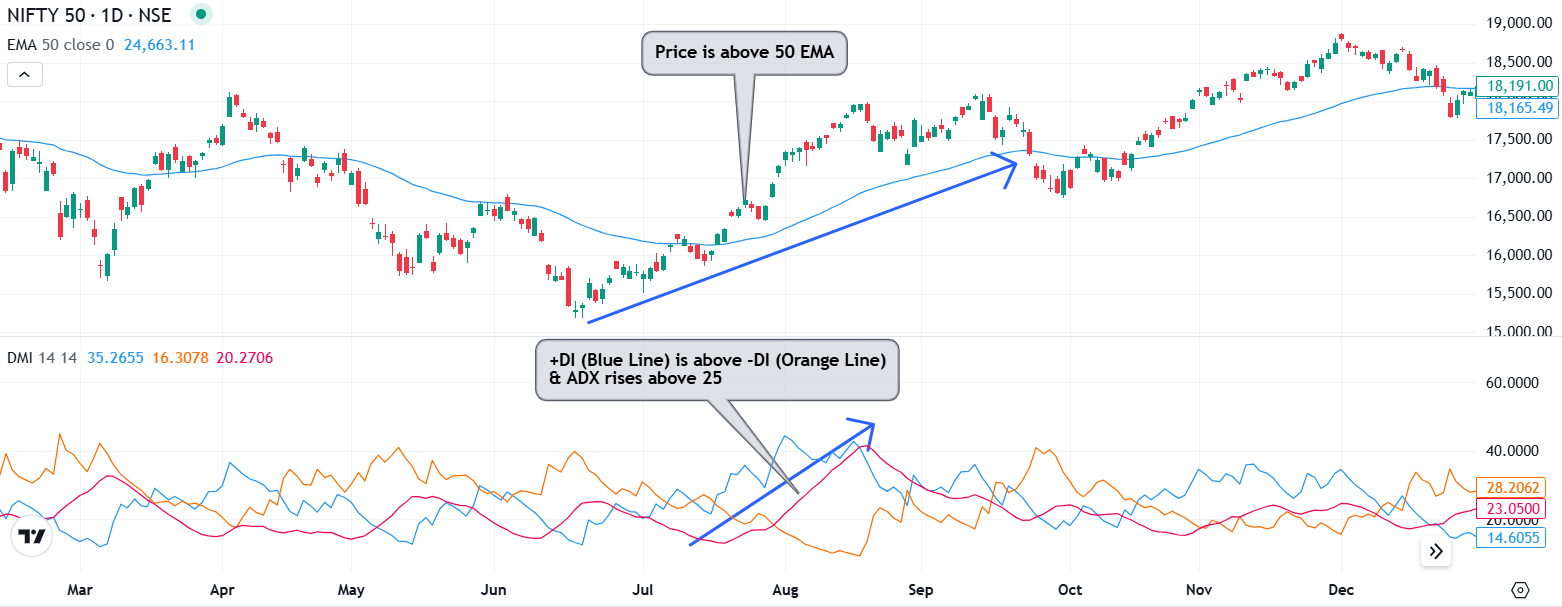
1. Combining ADX with Moving Averages
Moving averages help you spot the trend direction, but ADX adds another layer; it tells you how strong that trend really is. When both tools line up, your entries become a lot more confident. For example, if the price is above the 50 EMA, the +DI crosses over the -DI, and the ADX rises above 25, that’s a solid long setup. You can even wait for a price pullback to the EMA to get in at a better level.

2. Spotting Breakouts with ADX
Breakouts often occur after a period of low momentum, when the ADX is under 20, and the price is moving sideways. But when ADX suddenly spikes, it signals that volatility and momentum are returning.
Pair that ADX spikes with a strong move above resistance or below support, and use +DI or -DI to confirm direction. It helps you avoid false breakouts and jump in with confidence.
3. Timing Pullbacks Inside a Trend
Even strong trends have pullbacks, and that’s often your best entry point. When ADX is still above 25 but starts to flatten, it often means the trend is just taking a breather. If the price pulls back to support or resistance while ADX holds steady, that’s your cue. Once the price bounces back in the trend’s direction, you can consider entering or adding to your position.
What are the Limitations of ADX?
Knowing the limitations of the average directional index is also important for better strategy.
1. ADX as a Lagging Indicator
The ADX doesn’t give you early signals. It’s based on past price data and smooths things out over time, so it tells you what has happened, not what will. That’s why trends often get confirmed after they’ve already started.
Because of this delay, ADX works best as a confirmation tool. Use it to validate a trend, not to predict one. It’s great at helping you avoid fake trends, but not great for catching early entries or sudden reversals.
2. Challenges in Choppy Markets and False Signals
When markets move sideways, ADX tends to stay below 20. During these periods, +DI and -DI often crisscross randomly, leading to confusing or false signals that can throw you off. These false alarms can tempt you into bad trades. Since ADX can’t tell you exactly when a market shifts from trending to sideways, you might react late and end up stuck.
Conclusion
Average directional index is a powerful tool to confirm whether a market trend is strong or weak. But no indicator works perfectly on its own, not even the ones created by Wilder himself. That’s why pairing ADX with others like RSI, MACD, or Bollinger Bands makes your strategy stronger.
By pairing it with other technical analysis indicators, you can trade with more confidence, avoid fake breakouts, and manage risk smarter.
FAQs
ADX is calculated by smoothing the difference between the +DI and -DI over a set period (usually 14), indicating trend strength on a scale of 0 to 100.
The ADX shows if a market is trending strongly or weakly. It doesn’t show trend direction; +DI and -DI lines do that.
Use ADX with +DI and -DI to confirm trend strength and direction. A rising ADX above 25 signals a healthy trend worth trading.
For intraday, watch for ADX climbing above 20-25 to catch strong trends. Combine with moving averages or crossovers for entry signals.
Yes, it’s reliable for confirming trends and filtering out sideways markets, but it works best with other indicators, not alone.
RSI, MACD, and Bollinger Bands pair well with ADX to check momentum, reversals, and volatility for better trading signals.


