

Quantitative Funnel Research Report: Systematic Alpha Generation
- Share.Market
- 4 min read
- 18 Jun 2025


This report breaks down the performance evolution of your investment strategy across five progressive stages. By analyzing the transition from a broad universe to a concentrated, multi-factor portfolio, we can quantify how specific filters and weighting methodologies impact both the Compound Annual Growth Rate (CAGR) and risk-adjusted efficiency (Sharpe Ratio).
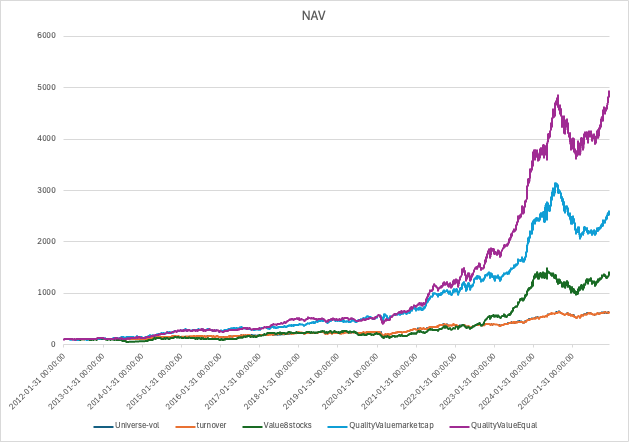
Funnel Performance Summary
| Stage | Strategy Description | CAGR (%) | Volatility (%) | Sharpe Ratio | Max Drawdown (%) | Return 2025 (%) |
| Stage 1 | Universe (Top 500 – 20% High Vol) | 14.19% | 14.93% | 0.95 | -35.6% | 7.02% |
| Stage 2 | Stage 1 + Liquidity Filter | 14.15% | 14.96% | 0.95 | -35.2% | 7.02% |
| Stage 3 | Value Sort (Top 8 Stocks) | 20.94% | 27.87% | 0.75 | -48.9% | 20.44% |
| Stage 4 | Quality + Value Composite (Top 8) | 26.27% | 21.37% | 1.23 | -34.4% | -0.97% |
| Stage 5 | Equal Weighting (High Quality Fair Price) | 32.30% | 19.14% | 1.69 | -31.6% | 17.11% |
Step-by-Step Return & Risk Attribution
Stage 1 to 2: The “Structural Cleaning” (Volatility & Liquidity)
- Action: Removed the most volatile 20% of stocks and applied a liquidity filter.
- Impact: Performance remained nearly identical (CAGR 14.19% vs 14.15%). However, this stage is not about adding returns; it is about scalability. The liquidity filter ensures the portfolio can be traded without high impact costs, while removing high-volatility stocks creates a more stable “soil” for the factors to grow.
Stage 3: The “Value” Explosion (Sorting Logic)
- Action: Concentrated the portfolio into the Top 8 stocks based purely on Value Score.
- Impact: CAGR soared to 20.94%.
- The “Value Trap” Risk: While returns jumped, Risk (Volatility) also skyrocketed to 27.87%, and Drawdown deepened to -48.9%. This proves that pure value, while powerful for returns, often captures “falling knives” or distressed companies that crash during market stress.
Stage 4: The “Quality” Guardrail (Factor Diversification)
- Action: Introduced a Quality score to create a Composite Factor (Quality + Value).
- Impact: This is the most efficient leap in the funnel. CAGR rose to 26.27% while Volatility decreased by over 6%.
- Key Insight: Quality acts as a filter that validates the Value score. It ensures the “cheap” stocks are also “good” companies with strong balance sheets. This significantly improved the Sharpe Ratio to 1.23.
Stage 5: The “Democratic” Boost (Weighting Logic)
- Action: Shifted from Market-Cap weighting to Equal Weighting for the final 8 stocks.
- Impact: CAGR reached its peak at 32.30%.
- Why it worked: Market-cap weighting often over-allocates to the “largest” stocks, which may have already seen their fastest growth. Equal weighting ensures that smaller, high-conviction winners contribute as much as the larger ones. It resulted in the highest Sharpe Ratio (1.69) and the most protected Drawdown (-31.6%).
Stage 3’s Massive -48.99% Drop: This is the “Value Trap” effect. By picking only 8 stocks based purely on Value, the portfolio likely became heavily concentrated in small/mid-cap cyclicals or beaten-down sectors. During the 2018–2019 midcap crash in India (and the subsequent 2020 COVID crash), these “Value” stocks did not have the Quality (Balance Sheet) cushion to stop the bleeding, leading to a near 50% wipeout from their peaks.
The Stage 4 “Quality” Rescue: When you introduced the Quality score, you effectively filtered out the companies that were “cheap for a reason” (e.g., high debt or falling ROE). Notice that the Drawdown recovered significantly to -34.44%. This proves that Quality factors act as a “circuit breaker” during market panics.
Stage 5’s Superior Protection (-31.62%): You might wonder why Equal Weighting improved Drawdown further. In a Market-Cap weighted portfolio (Stage 4), if your largest holding (the one with the biggest market cap) crashes hard, it drags the whole NAV down. By Equal Weighting (Stage 5), you diversified the “concentration risk.” The impact of a single stock’s failure was capped at 1/8th of the portfolio.
Conclusion: The Power of Compound Logic
The funnel demonstrates that sorting (Value) creates return potential, but filtering (Quality) and weighting (Equal Weight) are what make that return sustainable. You transitioned from a baseline return of ~14% to a specialized return of 32.3%, effectively doubling your compounding speed while keeping risk levels lower than the pure value stage.


