

I Backtested 200,000+ Trades Using the Supertrend Indicator. Here is What Actually Works.
- Share.Market
- 5 min read
- 04 Feb 2026


By Nishchal Jain, Quant Researcher, Share.market
In the world of trading, the “Supertrend” indicator is often marketed as a magic wand for catching market moves. But as a quantitative researcher, I don’t believe in magic—I believe in data.
I recently conducted a massive backtest on the Nifty 500 stocks from 2012 through 2025, across varying parameters (Periods 3 to 21) and Multipliers (1 to 3) on daily closing candles to find the truth. The results were surprising. They debunked a major myth about winning percentages and revealed exactly why most traders fail with this tool.
Here is what the data says about how to actually make money with the Supertrend.
1. The “Win Rate” Illusion
If you are looking for a strategy that wins 80% or 90% of the time, stop reading now. The Supertrend is not for you.
Across every single parameter I tested—from fast scalping settings (3,1) to slow swing settings (21,3)—the Win Rate remained remarkably consistent, hovering between 40% and 43%.
The Data:
- Worst Win Rate: ~40.7% (Settings: 3, 1)
- Best Win Rate: ~43.2% (Settings: 21, 3)
The Insight:
You are going to lose more often than you win. Period. But here is the good news: You don’t need a high win rate to be profitable.
The “Holy Grail” of this indicator isn’t avoiding losses; it’s the sheer size of the wins. The data shows that while you lose 60% of the time, your average win is significantly larger than your average loss. This is the classic “Trend Following” edge.
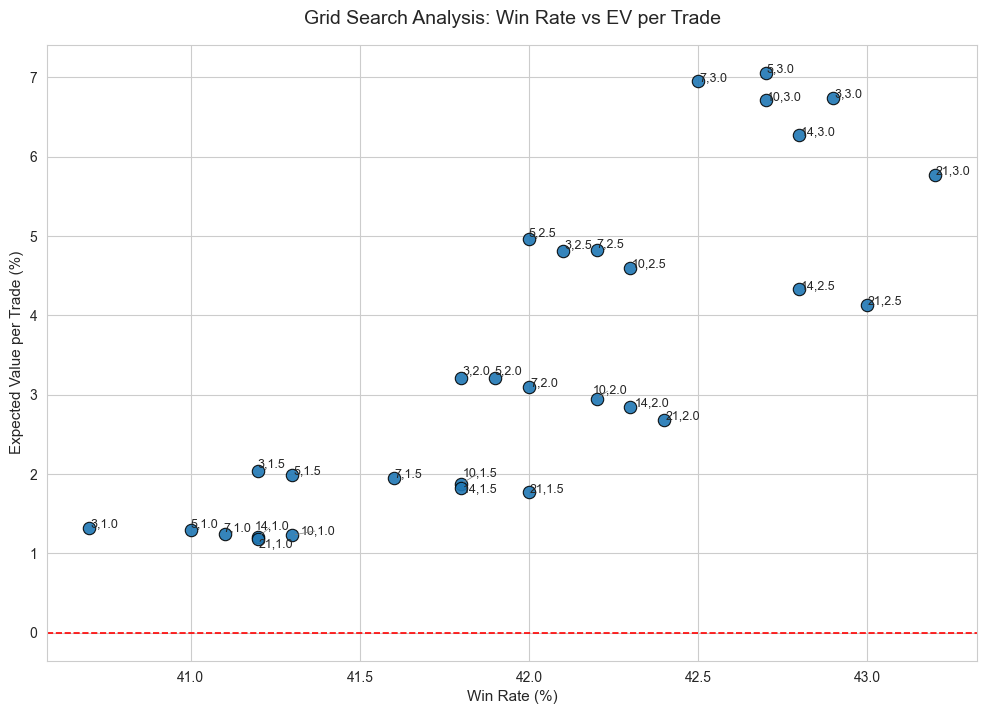
Figure 1: The Supertrend Trade-Off. This grid search shows that while Win Rate (X-axis) remains low across all settings, the Expected Value per Trade (Y-axis) varies dramatically. The best settings (top right) have the highest EV, not the highest win rate.
2. The Power of the Multiplier (The “Sniper” Effect)
The most critical variable in my research wasn’t the Period (the first number)—it was the Multiplier (the second number).
The Multiplier determines how far the Supertrend line sits from the price. A low multiplier (1.0) hugs the price tight; a high multiplier (3.0) gives it room to breathe.
Look at the difference in Average Win % when we shift the multiplier on a 3-Period setting:
| Parameter (Period, Mult) | Avg Win % | Avg Loss % | Win Rate |
| 3, 1.0 | 8.54% | -3.64% | 40.7% |
| 3, 1.5 | 11.69% | -4.69% | 41.1% |
| 3, 3.0 | 25.53% | -7.40% | 42.9% |
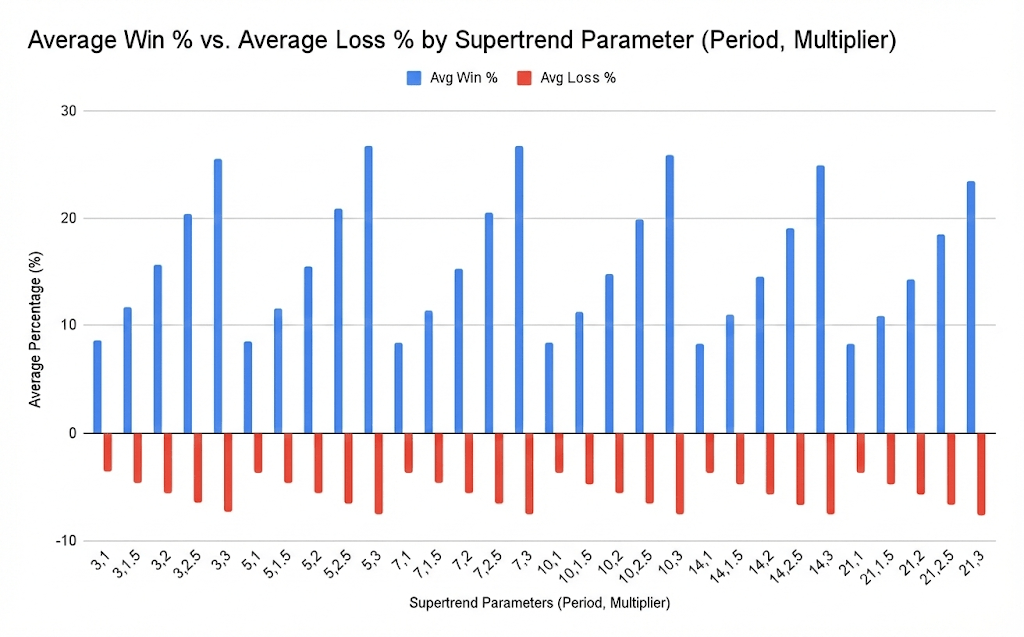
Figure 2: The Sniper Effect. Notice how the blue bars (Average Win %) grow significantly taller as the multiplier increases. By widening your stops, you stay in trades longer and capture massive, trend-defining moves that smaller multipliers miss.
The Takeaway:
Using a Multiplier of 3.0 effectively turns you into a sniper. You take far fewer trades (15k trades vs 65k trades in the sample), but when you hit, you hit hard. Your average winner jumps from 8% to over 25%.
If you have the patience to sit on your hands, the higher multiplier is mathematically superior in capturing massive trends.
3. The “Sweet Spot” for Efficiency
In quant trading, we often look at “EV per Trade per Day”—essentially, how efficiently is this strategy using my capital every day?
While long-term settings (like 21, 3) are stable, the aggressive, shorter-term settings actually produced the highest daily value in this dataset.
The Winner: (3, 3)
- Period: 3
- Multiplier: 3
- EV per Trade per Day: 0.097
This setting is a fascinating hybrid. It uses a very short lookback period (3) to react fast to new trends, but a wide multiplier (3) to avoid getting shaken out by noise. It forces you to hold winners for an average of 69 days, generating a massive risk-to-reward ratio.
4. The Psychology Trap: Can You Wait 70 Days?
Data is easy; trading is hard. The biggest hurdle revealed in this research isn’t mathematical—it’s psychological.
To achieve the best results (using higher multipliers like 2.5 or 3), you have to be willing to hold a position for a long time.
- Settings (3, 1): Average hold time = ~15 days.
- Settings (3, 3): Average hold time = ~69 days.
Ask yourself: Can I watch the market go up and down for two months without closing my trade early? If the answer is no, you will likely sabotage the strategy before the math plays out.
The Verdict
The Supertrend is a robust tool, but only if you treat it as a Trend Following system, not a quick-profit scalper.
- Accept the Losses: You will lose 6 trades out of 10. Position size accordingly so you survive the drawdowns.
- Widen Your Stops: Higher multipliers (2.5 to 3.0) drastically improve your Average Win %.
- Patience is Profit: The most profitable settings require holding trades for weeks, not minutes.
My Personal Pick?
If you have the stomach for volatility, the (3, 3) setting offers the highest daily expected value. If you prefer a smoother ride with slightly lower volatility, the (10, 3) or (14, 3) are excellent, stable alternatives.
Happy Trading!


