

The Complete Guide to Cycle Analysis in Financial Markets: Understanding Hurst’s Principles
- Share. Market
- 7 min read
- 03 Jun 2025


Cycle analysis is one of the most fundamental yet sophisticated approaches to understanding price movements in financial markets. By identifying recurring patterns and predictable waves, traders and investors can gain valuable insights into potential market turns before they occur.
This comprehensive guide explores the foundational principles of cycle analysis, practical applications, and how these concepts can transform your approach to market timing.
Understanding the Foundations of Cycle Analysis
Cycle analysis is based on the premise that financial markets move in predictable, recurring patterns that can be identified, measured, and forecasted. This approach was pioneered by J.M. Hurst, who outlined his theories in the groundbreaking book “The Profit Magic of Stock Transaction Timing”. According to Hurst, all financial markets exhibit cyclical behaviour that follows specific principles and can be analysed systematically.
At its core, cycle analysis views price movements as a composite of multiple cycles with different wavelengths and amplitudes occurring simultaneously. Rather than seeing market movements as random, cycle analysts recognise that these movements are the result of multiple overlapping cycles interacting with each other.
What Are Market Cycles?
Market cycles refer to trends or patterns that emerge during different market environments. During specific cycles, certain securities or asset classes outperform others because their business models align with conditions for growth. A complete market cycle is typically measured from one peak to the next peak, or from one trough to the next trough.
Types of Market Cycles
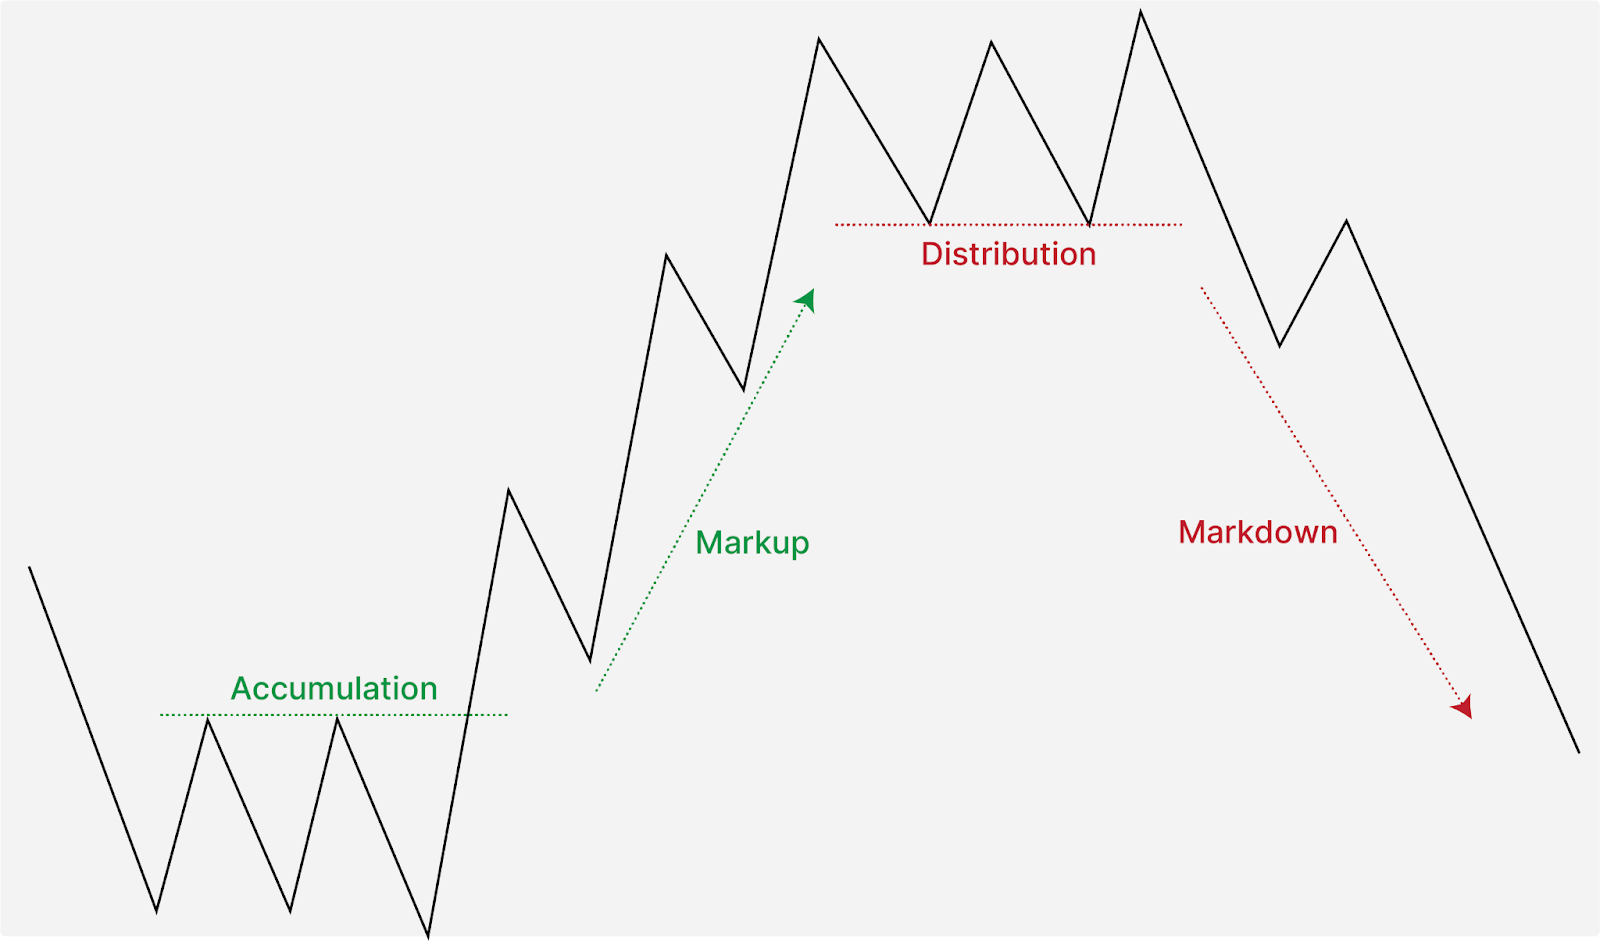
Most market cycles can be divided into four distinct phases:
- Accumulation Phase: This occurs after a market bottom when informed investors begin buying assets at lower prices while most market participants remain bearish. During this stage, prices typically move in a flat range, and securities can be purchased at significant discounts.
- Mark-up Phase (Uptrend): Prices begin to rise steadily as more investors recognise the upward trend. Technical traders identify the change in trend and purchase securities before they begin their run-up.
- Distribution Phase: This is when informed investors begin to reduce their positions as they believe the market is becoming overvalued. Similar to the accumulation phase, prices often move sideways in a range.
- Downturn Phase: Prices decline as selling pressure increases. Market sentiment turns negative, and bearish trends dominate.
Understanding these phases provides investors with a framework for identifying where the market stands and what might come next.
Hurst’s Seven Principles of Cycle Theory
J.M. Hurst’s cycle theory provides a comprehensive framework for analysing market cycles. He outlined seven fundamental principles that govern cycle behaviour in financial markets:
1. Principle of Cyclicality
The first principle states that all financial markets are composed of cycles. This means that price movements consist of a combination of specific waves and therefore exhibit cyclic characteristics. No market movement is truly random; rather, all price action can be broken down into component cycles of varying lengths.
Importantly, while all markets are affected by cycles, not all markets are affected by the same cycles1. This understanding allows analysts to group securities by similar cycle periods, which can improve the timing of entries and exits.
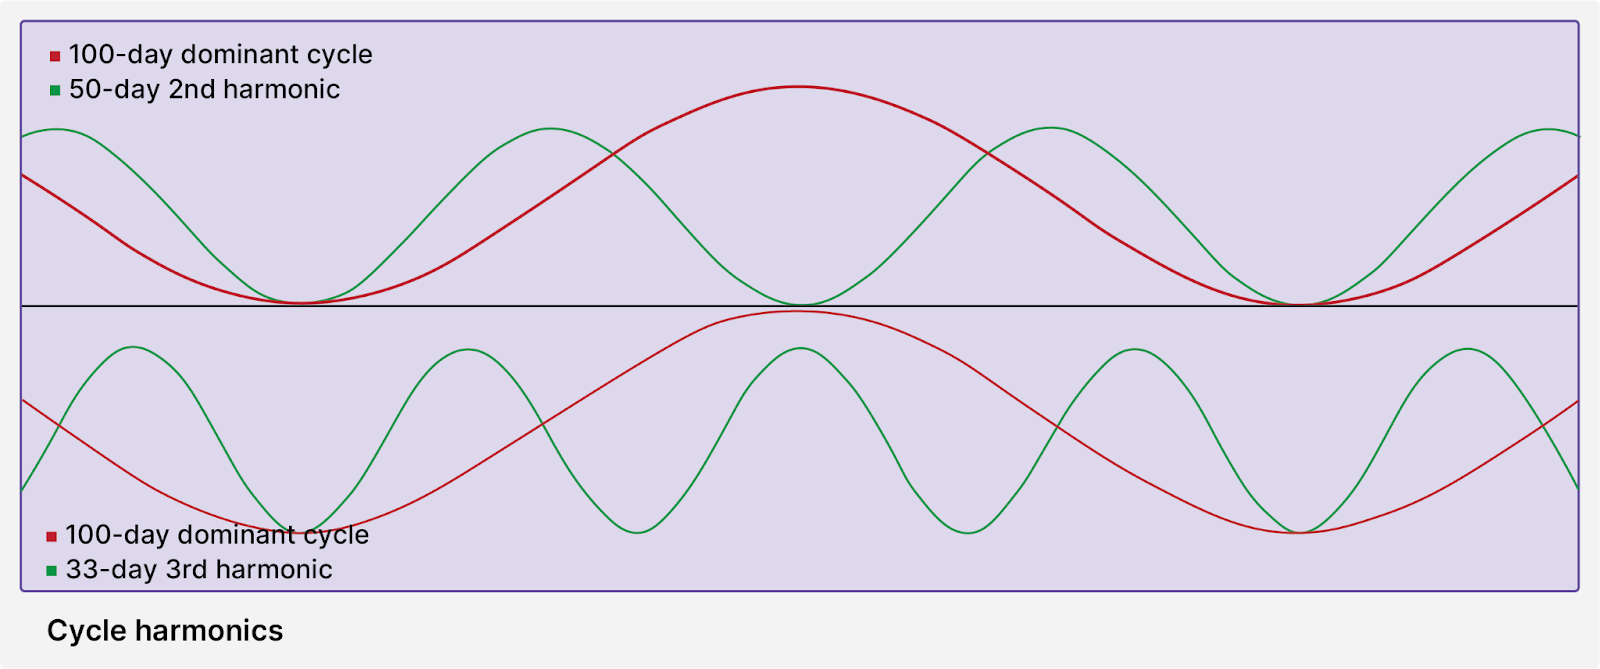
2. Principle of Harmonicity
According to this principle, cycles are typically related to one another by small whole numbers, most commonly multiples of two (2nd harmonic) or, less commonly, multiples of three (3rd harmonic). They may also be reciprocals of small whole numbers, commonly ½ or ⅓ (known as the ½ and ⅓ harmonics).
For example, if a dominant cycle has a period of 100 days, its harmonics might include cycles of approximately 50 days (2nd harmonic), 33 days (3rd harmonic), 25 days (4th harmonic), and so on. This relationship between cycles creates a structured, predictable framework for analysis.
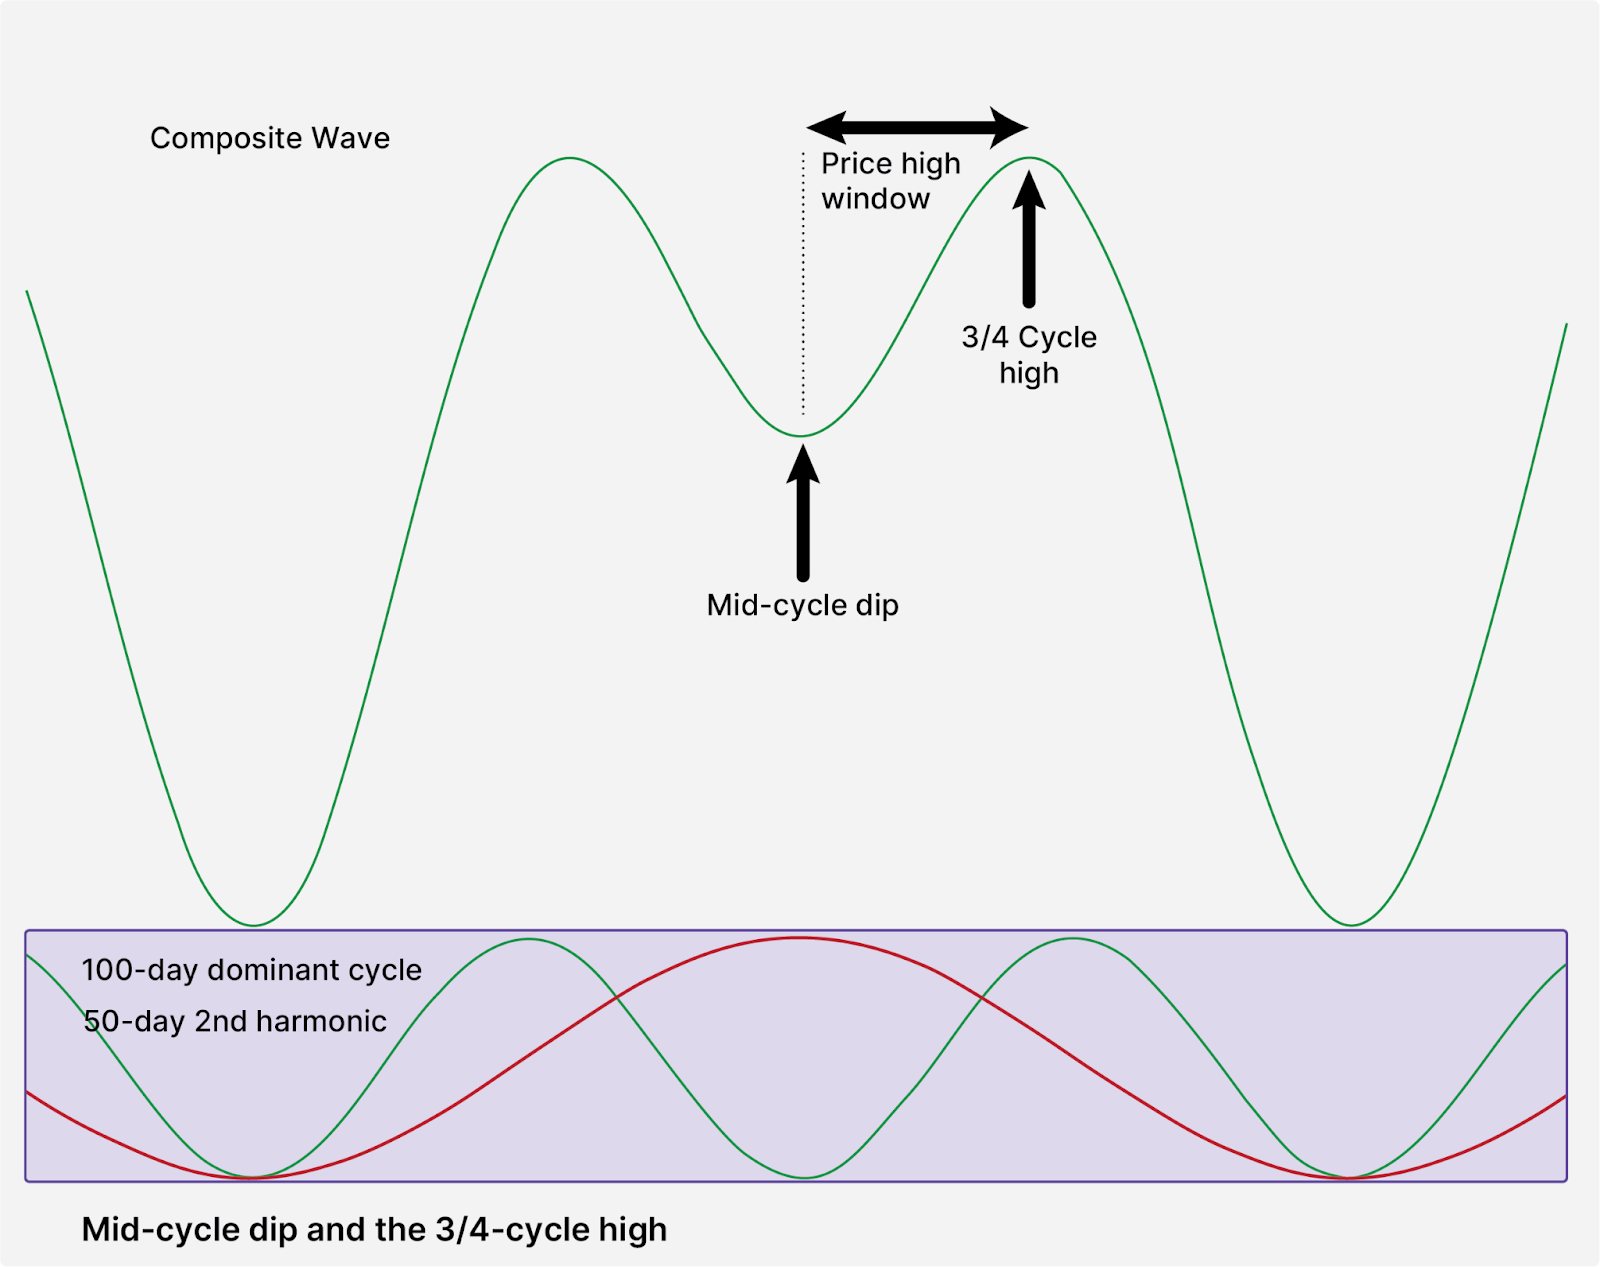
3. Principle of Summation
The principle of summation states that price is a composite wave, the sum of individual cycles plus the underlying trend. All cycles are equally weighted within a theoretical cycle model.
A key phenomenon that arises from summation is the “mid-cycle dip”. This occurs when a dominant cycle and its 2nd harmonic add together, creating a low in the composite wave directly at the peak of the dominant cycle. This signature pattern is one of the keys to identifying a dominant cycle visually.
As a result of the mid-cycle dip, a dominant cycle typically develops its price high between the ½ and ¾ points of the cycle. This provides traders with a window of time for an expected cycle high and helps verify the dominant cycle during analysis.
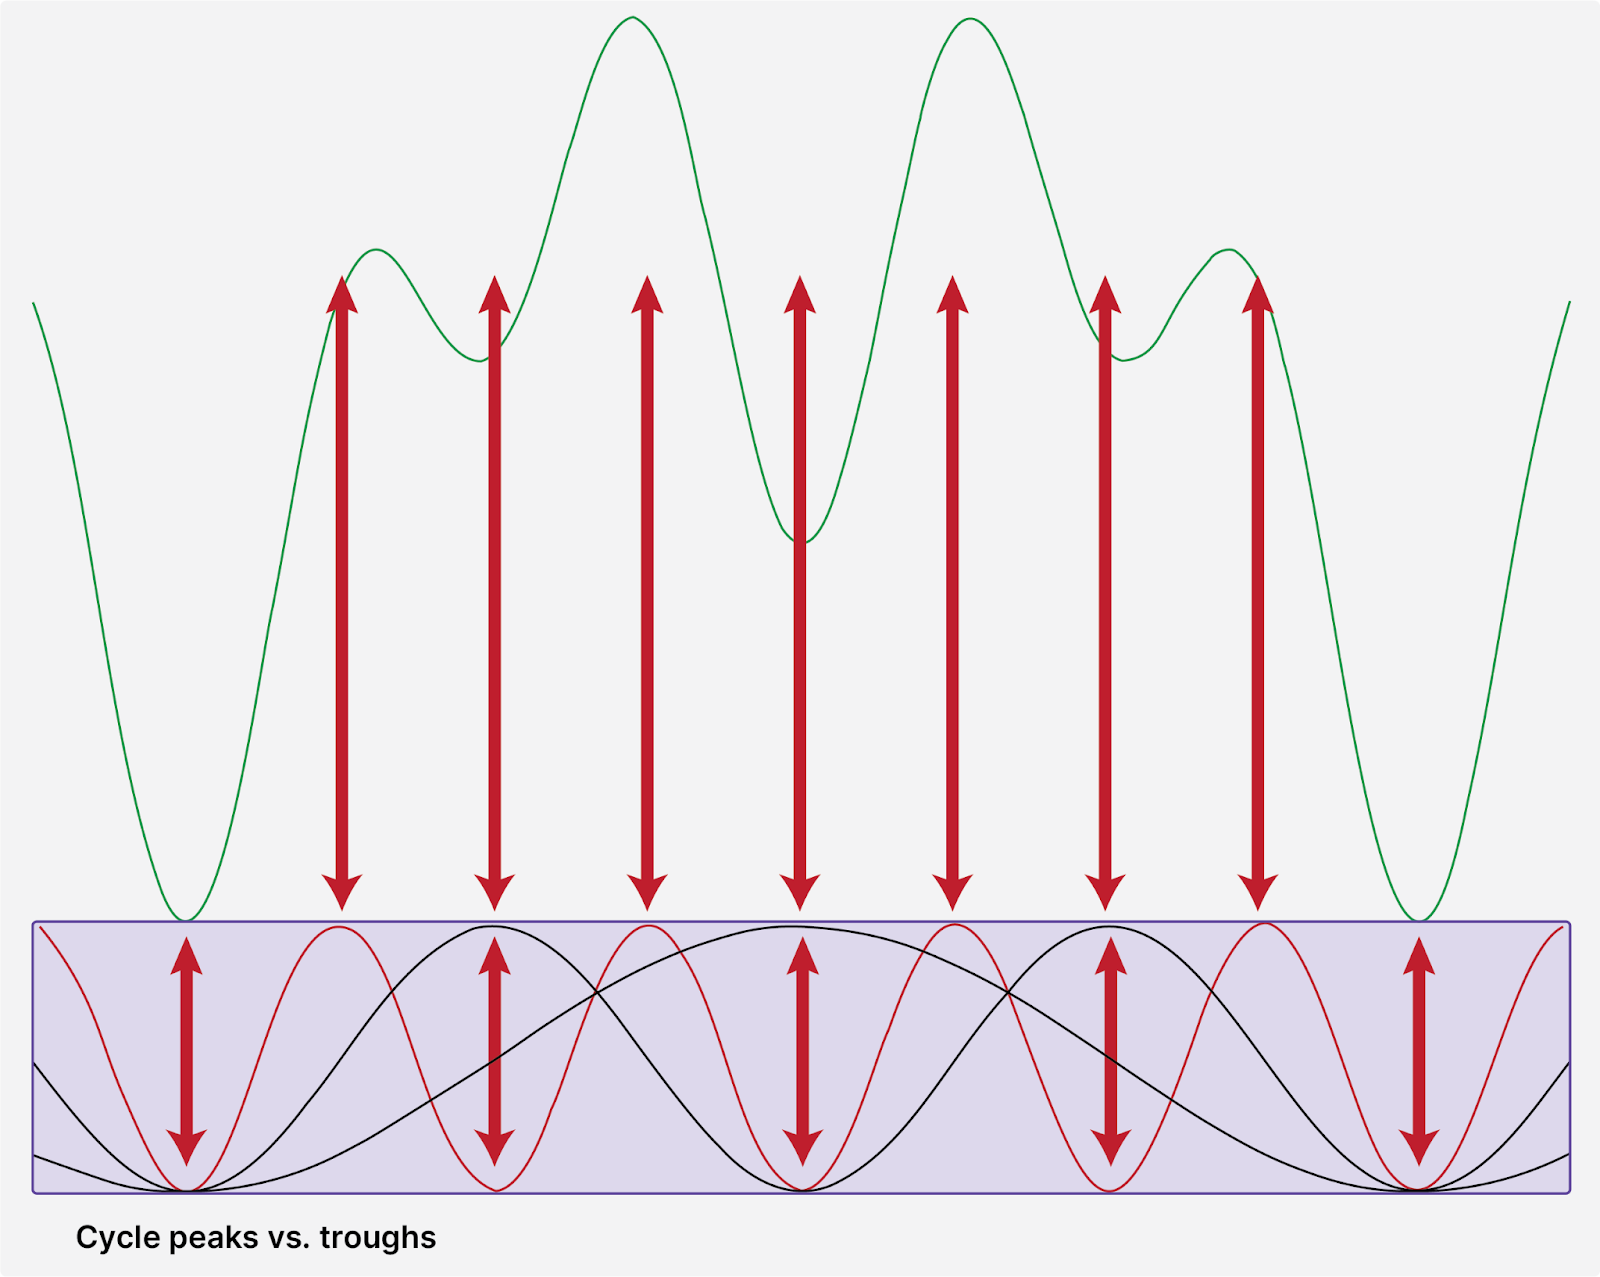
4. Principle of Synchronicity
The principle of synchronicity explains that cycle lows tend to bottom together or synchronise. An even harmonic will always bottom in tandem with its next larger period cycle.
This synchronisation helps explain why market bottoms often produce aggressive “V-shaped” capitulation lows, while market tops typically take more time to develop. When a dominant cycle is falling into its trough, all smaller even harmonics are declining simultaneously, adding downward pressure.
In contrast, cycle highs produce a different phenomenon-there is never more than one cycle peaking at a time. This results in a “rolling top” as the price works through each of the harmonic crests within a dominant cycle.
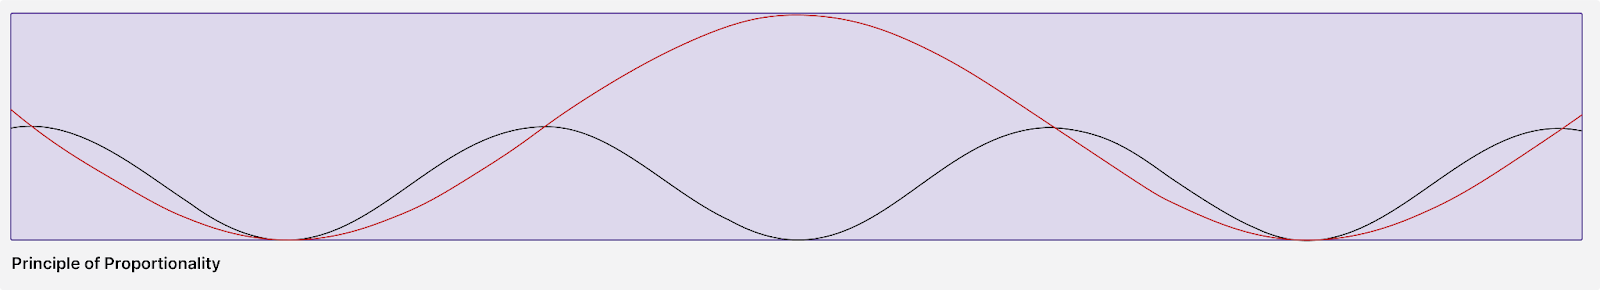
5. Principle of Proportionality
The principle of proportionality states that a cycle’s period is proportionally related to its amplitude. In simpler terms, longer cycles create the trend for smaller cycles to ride. This principle aligns with the fractal nature observed in various forms of technical analysis, such as the Elliott Wave Principle. Typically, the 2nd harmonic of a dominant cycle will have approximately half the amplitude of that dominant cycle.
Understanding this relationship helps analysts interpret the relative significance of different cycles and their potential impact on price movement.
6. Principle of Nominality
According to the principle of nominality, certain cycle periods appear more frequently across different markets and securities. Hurst identified a specific, nominal collection of harmonically related waves that are common to many price movements.
Hurst’s nominal model includes cycles ranging from very short-term (days) to very long-term (years). Some of the key periods in his model include cycles of 18 years, 4.5 years, 18 months, 40 weeks, 20 weeks, and shorter durations.
Another researcher, William C. Garrett, proposed a different nominal model with cycles based primarily on multiples of three: approximately 52 months, 17 months, 6 months, and 2.3 months (in trading days). These nominal models provide analysts with a starting point for identifying the cycles that might be influencing a particular market.
7. Principle of Variation
The principle of variation acknowledges that real-world cycles don’t behave with theoretical perfection. Variations occur in harmonicity, synchronicity, proportionality, and nominality.
Some common variations include:
- Cycle Fading: Dominant cycles may fade over time and be replaced by new cycles.
- Translation: Cycles may bottom early (left translation) or late (right translation) relative to expected cycle lows.
- Inversions: Sometimes cycles “invert,” forming a swing high at an expected cycle low.
Cycle inversions often indicate that the underlying cycle is fracturing into a different harmonic. There are two primary explanations for inversions: either the amplitude of the 2nd harmonic is decreasing and/or the amplitude of a larger harmonic is increasing, or the dominant cycle’s 3rd harmonic is present and influencing price movement.
Conclusion
Cycle analysis provides a powerful framework for understanding market movements and making more informed trading decisions. By recognising that markets move in predictable patterns governed by Hurst’s seven principles, traders can gain an edge in anticipating potential turning points. While no analytical method can predict market movements with perfect accuracy, a solid understanding of cycle theory combined with other technical analysis tools and sound risk management can significantly enhance your trading strategy and market perspective.
The beauty of cycle analysis lies in its blend of precision and flexibility. The mathematical foundations provide structure, while the principle of variation acknowledges the complex, dynamic nature of financial markets. By mastering these concepts, you can develop a more nuanced understanding of market behaviour and potentially improve your trading results.
Whether you’re a day trader looking for short-term opportunities or a long-term investor seeking to identify major market turns, cycle analysis offers valuable insights that can complement and enhance your existing approach to the markets.


