

Does MACD Actually Work in Indian Markets? We Backtested 25 Years of Data — Here’s What We Found
- Share.Market
- 5 min read
- 11 Jul 2025


Can one of the world’s most popular technical indicators actually help you trade better in India?
We tested it across Nifty 50, Next 50, Midcap 150, Smallcap 250, and Nifty 500 for 25 years.
The results were surprising.
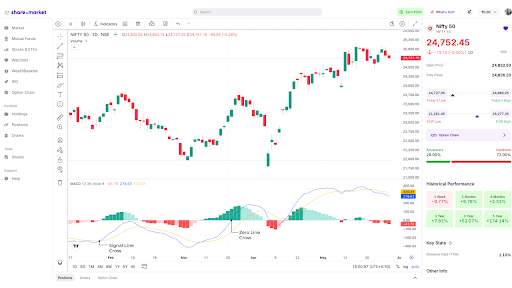
What Is MACD?
The Moving Average Convergence Divergence (MACD) is one of the most used technical indicators worldwide. It looks at the difference between two EMAs (usually 12-day and 26-day), and uses a signal line (9-day EMA of MACD) to generate buy/sell cues.
Traders usually look for:
- Signal Line Cross: MACD crosses above = buy; below = sell.
- Zero Line Cross: MACD moves above zero = positive momentum; below zero = negative.
Simple, intuitive — and now, rigorously tested on Indian markets.
We Backtested MACD for 25 Years. Here’s What We Did.
We ran three types of MACD strategies across five major indices from Jan 2000 to May 2025:
- Long-only: Buy on bullish signals; exit on bearish ones.
- Short-only: Short on bearish signals; cover on bullish.
- Combined: Flip between long and short positions.
Each trade’s performance was measured by:
- Expected Return per Trade:
= (Avg Win% × Win Rate + Avg Loss% × Loss Rate) / Total Trades - Expected Return per Day:
= Expected Return per Trade ÷ Average holding period
All data was adjusted for splits, dividends, and bonuses.
Top Takeaways from the Backtest
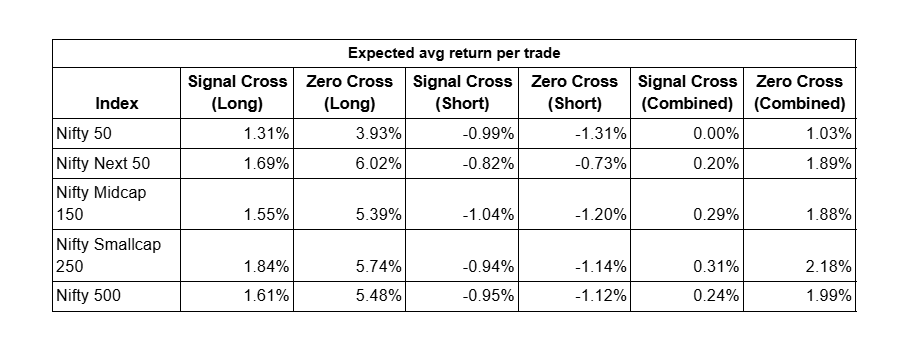
1. Long-only MACD strategies worked – especially Zero Line Crosses
MACD performed well over the long term when used in a disciplined, long-only setup.
- Nifty 50 Long on Zero Line Cross: 3.93% avg return per trade
- Nifty Smallcap 250: 5.74% per trade
- Nifty Next 50: 6.02% per trade
Across the board, Zero Line Crosses beat Signal Line Crosses in profitability — though they occurred less frequently.

2. Shorting didn’t work. Combined strategies underwhelmed.
Short-only trades based on MACD led to consistent losses.
Even switching between long and short trades didn’t offer much of an edge.
This suggests: MACD is more reliable for riding momentum upward than predicting downside turns.
3. Signal Line vs Zero Line? Both work — but one is better.
On the Nifty 50:
- Signal Line Cross: More trades (10,524), lower avg return (1.31%)
Zero Line Cross: Fewer trades (4,283), but stronger return (3.93%)

While Signal Line trades happened more often, Zero Line Crosses delivered higher-quality signals. Ideal for patient, trend-following traders.
4. Best Daily Returns Also Came from Long-Only Zero Crosses
The Zero Line long-only strategy beat all others on a per-day basis too.
Example:
- Nifty Smallcap 250 Zero Cross (Long) = 0.0918% daily return
Nifty 50 Signal Cross (Short) = -0.0451% daily return

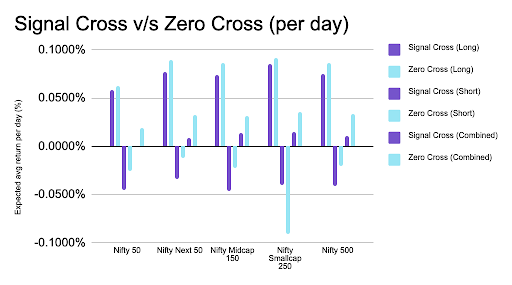
This adds further weight to the argument for staying long — and staying disciplined.
5. Broader Indices = Better MACD Results
The more volatile and broad the index, the stronger the MACD performance.
- Nifty 500 Long on Zero Cross: 5.48%
- Nifty Smallcap 250: 5.74%
- Nifty 50: 3.93%


MACD works better for smallcaps and midcaps, as compared to largecaps
A Word of Caution: It’s Not a Magic Formula
This is a directional study, not a ready-made trading system. Limitations include:
- EOD Prices Only: No real-time execution, no slippage, no fees included.
- Static Index Composition: Today’s index constituents were applied retroactively for uniformity.
Still, it gives us a strong directional view of MACD’s effectiveness.
Why Retail Traders Should Care
Most Indian traders rely on emotion, tips, or gut feeling. This backtest shows that rule-based momentum strategies like MACD can work, especially when applied with discipline and patience.
And the best part? You don’t need any coding or fancy tools.
MACD is built into almost every trading platform, including Share.Market.
Final Verdict: Does MACD Work in India?
Yes — but only if you stick to the long side and stay consistent.
MACD has historically worked across Indian indices, especially broader ones like Nifty 500 and Smallcap 250.
It’s not perfect. It’s not fast money.
But for those playing the long game, it’s a data-backed way to trade better.


